

You printed a QR code, stuck it on the counter, and waited for reviews to pour in. A few came. Then nothing. You are not alone. Most businesses place their Google review QR code in a single spot, never test alternatives, and wonder why the reviews stay flat. Placement is not a detail. Data from over 10,000 locations shows that moving a QR code from the center of a table to the edge can lift scan rates from 62% to 78%. A code on a receipt converts at 6% while a table tent hits 12%. The difference between a QR code that works and one that collects dust is where you put it and when customers see it.
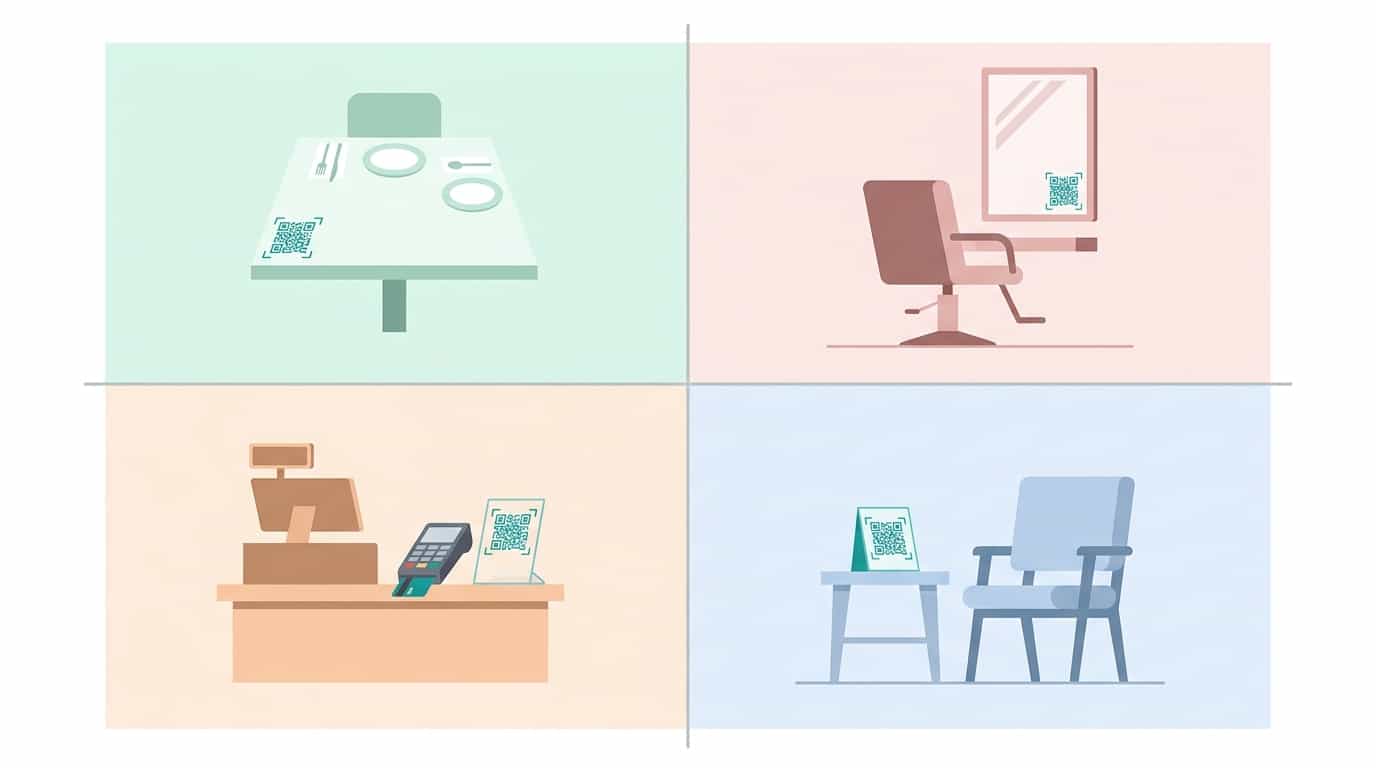
The goal is simple: catch your customer at the moment satisfaction is highest and friction is lowest, with a scannable code right in their line of sight. That moment is different for every business type, and the best placement for a restaurant is not the same as for a salon or a clinic. This guide ranks the 10 highest-converting placements based on real scan data and explains exactly how to use each one.
If you have not set up your code yet, start with our complete guide to creating a Google review QR code. If you already have one and want more reviews, you are in the right place.
Turn Every Visit Into a Review
VISU QR Ads places dynamic, trackable QR codes at the right spots in your business. See who scans, when they scan, and whether they leave a review. No guessing.
Why Placement Is the #1 Factor in Review Collection
BrightLocal's 2026 Local Consumer Review Survey found that 97% of consumers read online reviews for local businesses. 31% ignore businesses below 4.5 stars. 74% only care about reviews from the last 90 days. The message is clear: you need a steady stream of fresh reviews, not a one-time batch. And the single biggest variable in how many reviews you collect is not the platform you use or how often your staff asks. It is where you place the QR code.
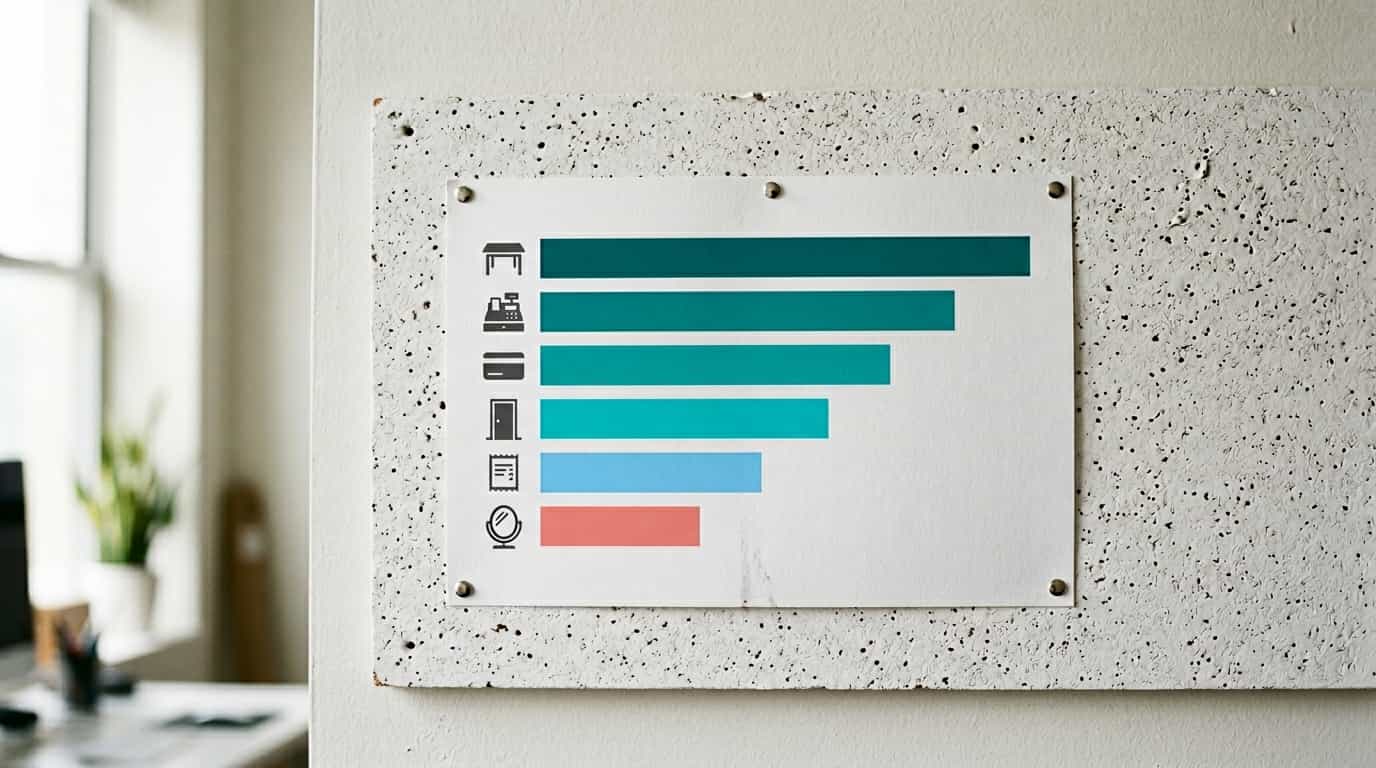
Scan rate data confirms this. Research from EasyMenus analyzing 2 million scans across 10,000 restaurant locations found that table edge placement achieved a 78% scan rate while table center sat at 62% and window-only placement dropped to 34%. MapLift reported that checkout counter QR codes convert at 15 to 20% for reviews, while receipt codes land at 6%. The Supercode team found that codes placed on tables get 3x higher scan rates than those at entrances because customers have more time, attention, and motivation.
These are not small differences. On 500 monthly customers, the gap between a 6% and a 20% scan rate is 70 additional scans per month. If even half of those scans convert to published reviews, that is 35 new reviews every month from placement alone. For a deeper look at the overall strategy, see our guide on how to get more Google reviews.
1. Checkout Counter or Payment Area
Scan rate: 15-20% for review-specific codes
The checkout counter is the single most reliable placement for review QR codes across all business types. The customer has just completed a transaction, satisfaction is peaking (or at least fresh), and there is a natural pause while they wait for a receipt, tap a card, or pack their bags. Their phone is often already in hand for mobile payment.
MapLift's testing found a 15 to 20% scan rate for review QR codes placed at eye level (3 to 5 feet high) near the payment terminal. The key is visibility during the wait. A code hidden behind the register or below counter level will not get scanned. Position it on an acrylic stand at eye level, directly next to or slightly above the card reader. Add a short call-to-action such as "Enjoyed your visit? Scan to leave a quick review" to remove ambiguity about what the code does.
For quick-service and fast-casual restaurants, counter placement outperforms every other spot with an 87% scan rate for menu codes. The same principle applies to review codes: when the ordering or payment interaction happens at a counter, that counter becomes your highest-value real estate for review collection.
2. Table Tents and Table Edge Displays
Scan rate: 12% for review codes, up to 78% for menu codes at table edge
For sit-down restaurants, cafes, and any business with seating, table tents are the workhorse of QR code placement. MapLift's testing confirmed that table tents produce a 12% scan rate for review codes versus 6% for receipt codes. EasyMenus data goes further: table edge placement hits 78% scan rates compared to 62% at table center and just 34% for window-only codes.
The edge versus center distinction matters. A code at the table edge sits in the customer's natural sight line. It does not block conversation, does not get knocked over when food arrives, and does not feel like clutter. Testing across 50 tables showed 79% scan rates for edge placement on 4-top tables versus 58% for center. For 2-person tables, center is acceptable at 71%. For bar seating, center placement actually wins at 84% because there is no across-table conversation to block.
The critical addition is explanation text. A QR code with a clear label ("Scan for menu" or "Leave a review") achieves 73% scan rate versus 39% without any text. That single line of explanation nearly doubles engagement at zero cost. For more on how this works across retail environments, see our guide to QR codes in retail.
3. Receipts and Printed Invoices
Scan rate: 6-8% for review codes
Receipts convert at a lower rate than table tents or counter displays, but they have a unique advantage: they travel with the customer. A receipt goes into a pocket, a bag, or sits on a kitchen counter at home. It is a reminder that extends beyond the moment of the visit.
Place the QR code at the bottom of the receipt near the thank-you message. The customer's eye naturally travels down after checking the total. A short CTA like "Scan to share your experience" pairs well with this placement. MapLift found that mentioning the QR code verbally ("There's a QR code on your receipt if you'd like to leave a review") boosted scan rates by an additional 40%.
One important caveat from DigitalHarvest: do not put a QR code on a digital invoice that customers view on their phone. They cannot scan a code that is on the same screen they would use to scan it. For digital formats, use a clickable link. Reserve QR codes for physical, printed receipts only.
Track Every Scan, Optimize Every Placement
VISU QR Ads shows you which placement spots drive the most reviews. Real-time analytics. No reprinting when you need to change destinations.
4. Exit Door or Post-Service Point
Scan rate: 8-12% depending on dwell time at exit
The exit is the last physical touchpoint before the customer leaves. For businesses where the checkout and the exit are separate (restaurants, clinics, salons, gyms), this is a second opportunity to capture a review from someone who did not scan at the counter or table.
The ideal format is a wall-mounted display or acrylic stand at eye level next to the door. The customer is pausing to push a door, grab their coat, or say goodbye. That 3 to 5 second pause is enough to notice and scan a well-placed code. The CTA here should feel like a farewell: "Thanks for visiting! Scan to tell us how we did."
Exit placement works especially well for service businesses like salons and clinics where the customer has just completed an experience (haircut, treatment, consultation) and the satisfaction is immediate. The review is anchored to a specific experience, making it more detailed and authentic.
5. Business Cards (Back Side)
Scan rate: Varies widely by follow-up process
DigitalHarvest ranks this as the number one placement for home service businesses, and the logic is sound. A technician, consultant, or professional hands the card directly to the customer at the end of a face-to-face interaction. The front carries contact information. The back carries the review QR code with a short CTA.
The card is a physical leave-behind that survives the visit. It sits on a counter, in a drawer, or next to other paperwork. When the customer decides to leave a review later, the code is right there. No searching, no remembering the business name, no navigating Google Maps. Scan and review.
This placement performs best when paired with a verbal ask ("We'd love your feedback. There's a QR code on the back of the card") and a follow-up system (email or SMS reminder 24 hours later). The card alone will not generate high scan rates. The card plus an ask plus a follow-up creates a three-touch review system.
6. Packaging Inserts and Bags
Scan rate: 4-8% for review codes
For e-commerce businesses with physical shipments, retail stores with branded bags, or restaurants with takeout packaging, an insert card is the equivalent of a table tent that travels home with the customer. A small card (business card size or slightly larger) inside the bag or box with the QR code and a "How was your experience?" CTA catches the customer during the unboxing moment.
Chen's Restaurant added a QR code to takeout bags with the message "Order direct next time, save 15%" and saw 147 weekly scans converting to 41 repeat orders. The same principle applies to review codes. The unboxing moment is a high-attention, high-satisfaction window. The product is fresh, the experience is new, and the customer has the insert physically in their hands.
Keep the insert simple. One QR code. One purpose. One sentence of instruction. Multiple QR codes on a single insert create confusion about which one to scan and which one matters.
7. Waiting Areas and Lobbies
Scan rate: 6% for menu or service codes, higher for entertainment
Waiting rooms in clinics, salons, auto repair shops, and professional offices are underutilized for review collection. Customers sitting in a waiting area have time, attention, and their phone in hand. The challenge is that they have not yet experienced the service, so asking for a review at this stage is premature.
The better approach for pre-service waiting areas is to use the QR code for engagement rather than reviews. Marcus tested three approaches in a restaurant wait area: a QR code to the menu achieved a 6% scan rate, a "restaurant story" video hit 23%, and a trivia game reached 34%. Entertainment and information outperform transactional asks before the service begins.
For post-service waiting areas (such as the checkout lobby of a clinic or the pickup area of an auto shop), the dynamic shifts. The customer has completed the experience and is simply waiting for paperwork or payment processing. This is a strong moment for a review QR code, similar to the exit door placement. A display in the post-service waiting area with "While you wait, tell us how we did" can capture reviews from customers who have 2 to 5 minutes of idle time.
8. Window and Entrance Displays
Scan rate: 11% for menu or business info codes
Window QR codes serve a different purpose than in-store codes. They are for customer acquisition, not review collection. A code on the front window lets passersby check your menu, hours, or services before walking in. Maria added an entrance QR code and saw 89 weekly scans converting to 34 walk-ins (38% conversion), generating an estimated $6,528 in monthly revenue.
For reviews specifically, window placement is weak. Customers outside the store have not experienced your service yet. The rare exception is a "See What Our Customers Say" display that links to your Google reviews page as social proof for foot traffic. This is not a review collection tool. It is a trust-building tool that uses your existing reviews to attract new customers.
If you use window placement, size matters. A code viewed from 6 to 8 feet requires a minimum of 3 inches to scan reliably. High contrast (black on white) is mandatory for outdoor conditions with variable lighting. Test scannability at different times of day, especially during direct sunlight hours when glare can kill scan success.
9. Digital Signage and Menu Boards
Scan rate: 67% for menu codes on static displays
Digital screens in restaurants, retail stores, and service lobbies can display QR codes at large sizes with high contrast. The advantage is flexibility: you can rotate between a review code, a loyalty sign-up, and a special offer throughout the day. The disadvantage is that rotating content reduces any single code's exposure time.
For review collection, a static (non-rotating) display performs better. The code needs to be visible long enough for a customer to notice, pull out their phone, and scan. If the screen cycles every 10 seconds, many customers will miss the review prompt entirely. Dedicate at least 30 seconds per rotation to a review CTA, or better yet, keep the review code permanently in a corner of the screen.
Digital displays work best in waiting areas and checkout lines where customers have dwell time. A large screen with "Leave a review" and a 3 to 4 inch QR code at eye level can outperform a small table tent simply through visibility. To learn why understanding this matters for performance, see our post on why static review QR codes underperform.
10. Thank-You Postcard Follow-Up
Scan rate: Varies, but highest conversion-to-review ratio of any offline method
A physical postcard mailed or handed after service is the most deliberate and differentiated review strategy on this list. It costs more than every other placement (printing plus postage), but it signals effort and care that a counter display cannot match. The customer receives a tangible reminder days after their visit, often at a moment when the memory is still positive but the initial rush of the day has passed.
The format is simple: a thank-you message on the front, a QR code and review CTA on the back. "Would you recommend us? Scan this code to share your experience. Your review helps our local business grow." DigitalHarvest recommends this as the differentiator placement because it reaches customers who forgot to review at the point of service and gives them a low-friction second chance.
For high-volume businesses, postcard follow-ups can be automated through print fulfillment services triggered by your CRM or POS system. The per-unit cost drops with volume, and the ROI is measurable if you use a dynamic QR code that tracks scans from the postcard separately from your in-store codes. For strategies on tracking this effectively, see how to track your review QR code performance.
Best Placements by Business Type
| Business Type | Top Placement | Second Placement | Third Placement |
|---|---|---|---|
| Restaurant (sit-down) | Table tent / table edge | Receipt bottom | Exit door display |
| Restaurant (fast-casual) | Ordering counter | Table edge | Takeout bag insert |
| Salon / Barbershop | Mirror station display | Checkout counter | Business card back |
| Clinic / Dental | Post-service waiting area | Checkout counter | Discharge paperwork |
| Gym / Fitness studio | Exit turnstile / door | Reception desk | Locker room mirror |
| Retail store | Checkout counter | Bag insert | Window display (social proof) |
| Home services | Business card back | Paper invoice bottom | Thank-you postcard |
| Hotel / B&B | Room desk / nightstand | Checkout counter | In-room TV screen |
Why Static QR Codes Underperform
A static QR code is a one-way ticket to a fixed URL. You print it, place it, and hope for the best. You have no idea how many people scanned it, when they scanned, whether they actually left a review, or if the link still works. Google review URLs can change when you update your Business Profile, and a broken link on a printed code could go unnoticed for months.
A dynamic QR code solves every one of these problems. The printed code never changes, but the destination it points to can be updated anytime. You can redirect from your Google review page to a seasonal promotion and back again without reprinting. More importantly, dynamic codes track scans: how many, when, from where, and on what device.
This data transforms placement from guesswork into strategy. You can compare your counter display against your table tent and your receipt code, see which one drives the most scans, and double down on what works. You can test a new CTA message on your counter display and measure the impact within a week. You can identify that your Friday evening scans are 3x higher than Tuesday morning and adjust staffing and prompts accordingly.
VISU QR Ads is built specifically for this. One QR code per placement, full analytics dashboard, and an optimized review flow that maximizes the conversion from scan to published review. The code you print today works forever because the system behind it keeps evolving. For a deeper breakdown of why this matters, see our analysis of why static review QR codes underperform.
Frequently Asked Questions
Where is the single best spot to place a Google review QR code?
The checkout counter or payment area is the most consistent high-performer across all business types. Customers have just completed a transaction, satisfaction is fresh, and there is a natural pause in the interaction. MapLift data shows a 15 to 20% scan rate for review codes placed at eye level near the payment terminal. For sit-down restaurants specifically, a table tent at the table edge outperforms everything else with scan rates up to 78%.
How many QR codes should I place in my business?
Two to three placements is the sweet spot. One primary placement (counter or table), one secondary (receipt or exit), and one follow-up (business card or postcard). More than three review-specific codes in one location creates confusion. Each code should be at a different point in the customer journey so they serve as sequential reminders rather than competing prompts.
Should I use a static or dynamic QR code for reviews?
Dynamic, always. Static codes offer zero tracking and cannot be updated if the link changes. Dynamic codes let you measure scan rates by placement, update destinations without reprinting, and identify which spots drive the most reviews. The difference is the difference between guessing and knowing.
Does adding text next to the QR code actually matter?
It nearly doubles scan rates. A QR code with explanation text ("Scan to leave a review") achieves a 73% scan rate versus 39% without any text, according to restaurant placement testing. The text removes uncertainty about what the code does and tells customers exactly what to expect after scanning.
Can Google penalize me for collecting reviews via QR codes?
Google does not prohibit QR codes for review collection. However, Google has flagged "review bursts" where a large number of reviews arrive from the same location in a short time, which can trigger a temporary posting suspension. The solution is steady collection over time rather than a single-day push. A well-placed QR code that generates 1 to 3 reviews per day is more sustainable than a campaign that generates 50 in a weekend.
Place Smarter. Collect More Reviews.
VISU QR Ads gives you dynamic QR codes with full analytics, so you know exactly which placements work. No reprinting. No guessing. Just data-driven review growth.