

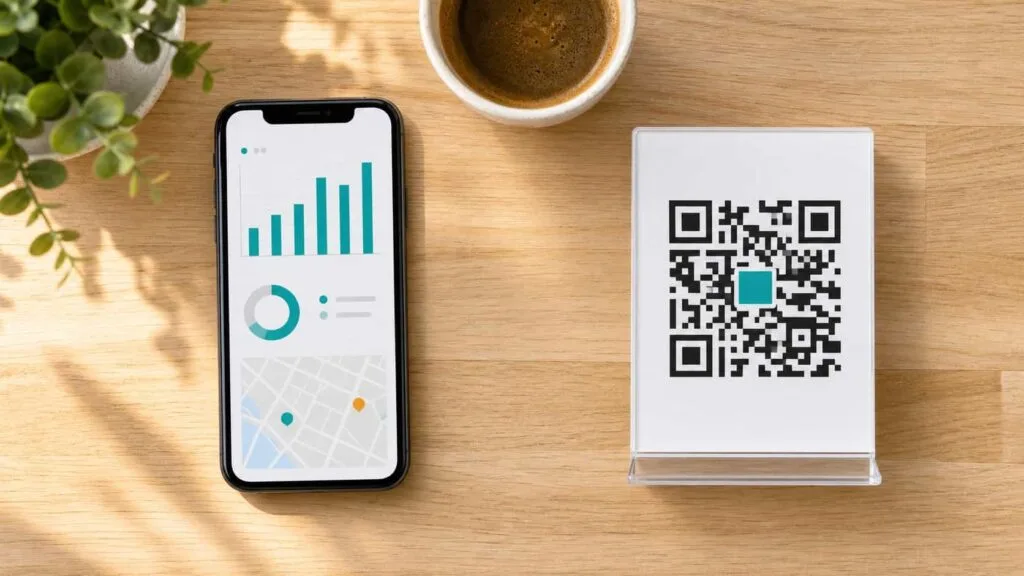
You printed the QR code. You stuck it on the counter. Customers scan it sometimes, you think. New reviews trickle in, maybe from the code, maybe from a text you sent, maybe because someone just felt like it. You have no idea which one is working and which one is decoration. That is not a review strategy. That is a lottery ticket taped to your cash register.
Here is the uncomfortable truth about most review QR code setups. The code itself works fine. It scans, it opens the review page, customers can leave a star rating. The part nobody thinks about is everything that happens between the scan and the submitted review. And everything that does not happen, because nobody is watching. Someone scans but the page loads slowly on their phone. Someone opens the review form but gets distracted and closes it. Someone scans on Tuesday at 2pm when your code has been sitting there since last month and the link is stale. You would never know any of this without tracking. And most businesses do not track anything.
Here is what tracking actually looks like when you do it right. You know that 47 people scanned your table tent this week but only 9 left a review. You know the code on the mirror gets three times more scans than the one by the register. You know Friday between 6pm and 8pm produces more scans than the entire rest of the week combined. And because you know all of this, you can make changes that double your review count without printing a single new code. That is what a Google review QR code looks like when you actually pay attention to what it is telling you.
See What Your QR Codes Are Actually Doing
VISU QR Ads tracks every scan in real time. Who scanned, when, where, and whether the review page loaded. Stop guessing. Start measuring.
Why Most Review QR Codes Are Flying Blind
A Bitly survey found that 87% of marketers cannot trace what happens after someone scans their QR code. Eighty-seven percent. That means nearly nine out of ten businesses deploying QR codes, for reviews, for menus, for anything, have zero visibility into whether those codes are producing results or collecting dust.
The reason is almost always the same. They used a static code. A static QR code is a direct link baked into the pattern. It works like a printed URL. No middleman, no data collection, no record that the scan ever happened. It is the equivalent of handing out business cards and hoping someone calls. You know how many you printed. You have no idea how many produced a response.
Dynamic codes fix this by routing every scan through a tracking layer. The user does not notice any difference. The review page opens just as fast. But in the background, the platform logs the scan: timestamp, device type, approximate location, and whether the destination loaded successfully. This is not surveillance. It is basic campaign measurement, the same kind of data you get from any email campaign or website analytics tool. The difference is that most businesses apply that thinking to their digital marketing but treat their physical review codes as set-and-forget. For a deeper dive into QR code tracking and analytics, see our full guide.
The Numbers That Actually Tell You Something
Not every metric matters equally. When you open your QR analytics dashboard, you will see a wall of numbers. Total scans, unique scans, devices, locations, timestamps. Some of those numbers change your decisions. Others are just interesting. Here is how to tell the difference.
Total scans versus unique scans is the first thing to look at. Total scans count every scan event, including repeat scans from the same phone. Unique scans count individual devices. If your table tent shows 50 total scans and 45 unique scans, you are reaching 45 different people. Good reach, low repeat. If it shows 50 total and 12 unique, the same people are scanning multiple times without completing a review. That is a conversion problem, not a visibility problem, and it requires a different fix.
Time patterns reveal when your customers are most receptive. Restaurants typically see scan peaks during Friday and Saturday dinner service, between 6pm and 9pm. Barbershops see steady scans throughout the day with a slight bump on Saturday mornings. Gyms peak right after group classes end. If 40% of your weekly scans happen on Friday evening and you are running out of receipt paper on Thursday night and not replacing the table tent until Monday, you just lost your best window.
Device data tells you something subtler. If 80% of your scans come from iPhones, your review landing page needs to load flawlessly on Safari first. If you are seeing a high percentage of Android scans, test the page on Chrome for Android specifically. Rendering differences between browsers can break the review form on some devices, which shows up as scans with no resulting review. These are the kinds of engagement metrics that matter, the ones that point to a specific action you can take.
The Scan-to-Review Funnel (and Where People Disappear)
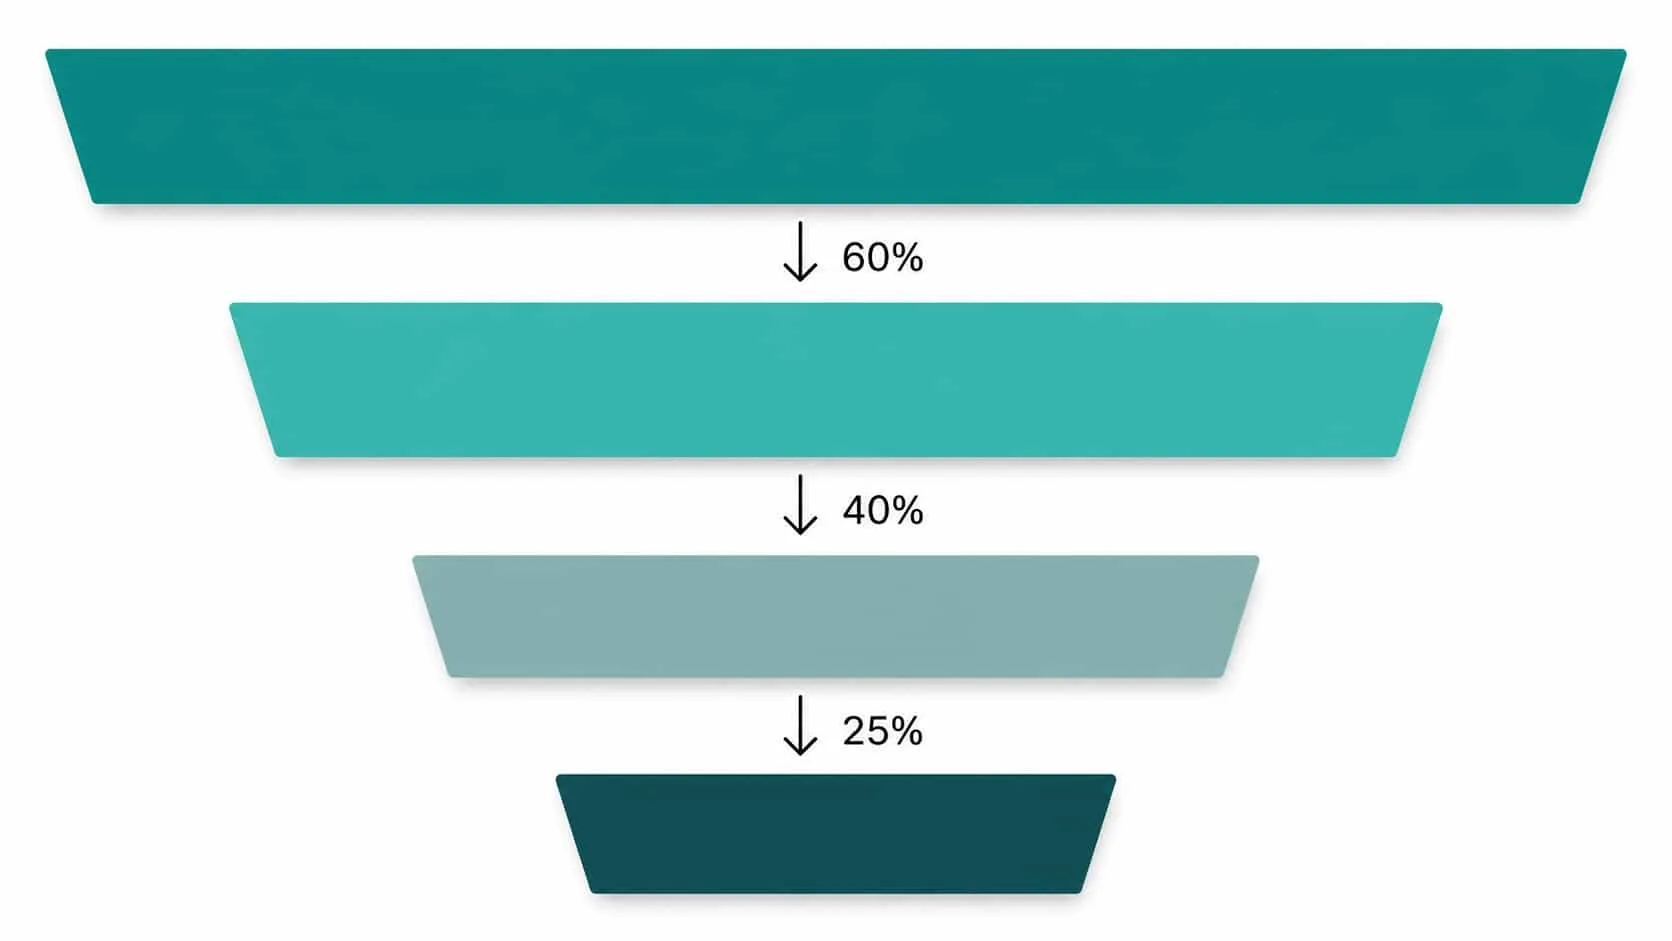
Think of the review process as a funnel with four stages. Stage one: the customer scans the code. Stage two: the review page loads on their phone. Stage three: they tap the star rating and start typing. Stage four: they hit submit. At every stage, people drop off. The question is how many and why.
A well-placed dynamic review QR code typically converts at 15 to 20%. That means for every 100 scans, 15 to 20 people actually submit a review. Sounds low until you realize this is normal for any conversion funnel. Email marketing campaigns convert at 2 to 5%. Social media ads convert at 1 to 3%. A 15% conversion from a physical scan is actually excellent.
The biggest drop-off usually happens between stage two and stage three. The page loads but the person does not start the review. The reasons are predictable. The page took too long to load (anything over 3 seconds on mobile loses people), the Google sign-in screen appeared and they did not want to log in on the spot, or they got distracted by a notification and never came back. You cannot fix what you cannot see. Without scan tracking, all you know is that you got 4 reviews this week. With tracking, you know that 30 people scanned, 28 pages loaded, but only 4 reviews were submitted. Now you know the problem is not visibility or placement but the post-scan experience.
The second biggest drop-off is between stage three and four. They started typing but did not finish. This happens when the review feels like too much work. Google's review form is already simple, but the context matters. If someone is standing at a counter with a line behind them, they will not write three paragraphs. They might tap five stars and submit with no text, or they might abandon entirely. Knowing this helps you adjust when and where you ask. The waiting area where people have idle time converts better for detailed reviews than the checkout line where they feel rushed.
Find the Leak in Your Funnel
VISU QR Ads shows you scans, page loads, and drop-off points. When you see where people disappear, you know exactly what to fix.
How to Test Placements Against Each Other
This is where tracking pays for itself in the first week. Create two dynamic QR codes with identical design and identical destination, then place them in different locations in your business. One on the table tent, one on the receipt. One on the mirror, one on the checkout counter. One at the exit door, one on the locker room wall. Give each code a different name in your dashboard so you can tell them apart.
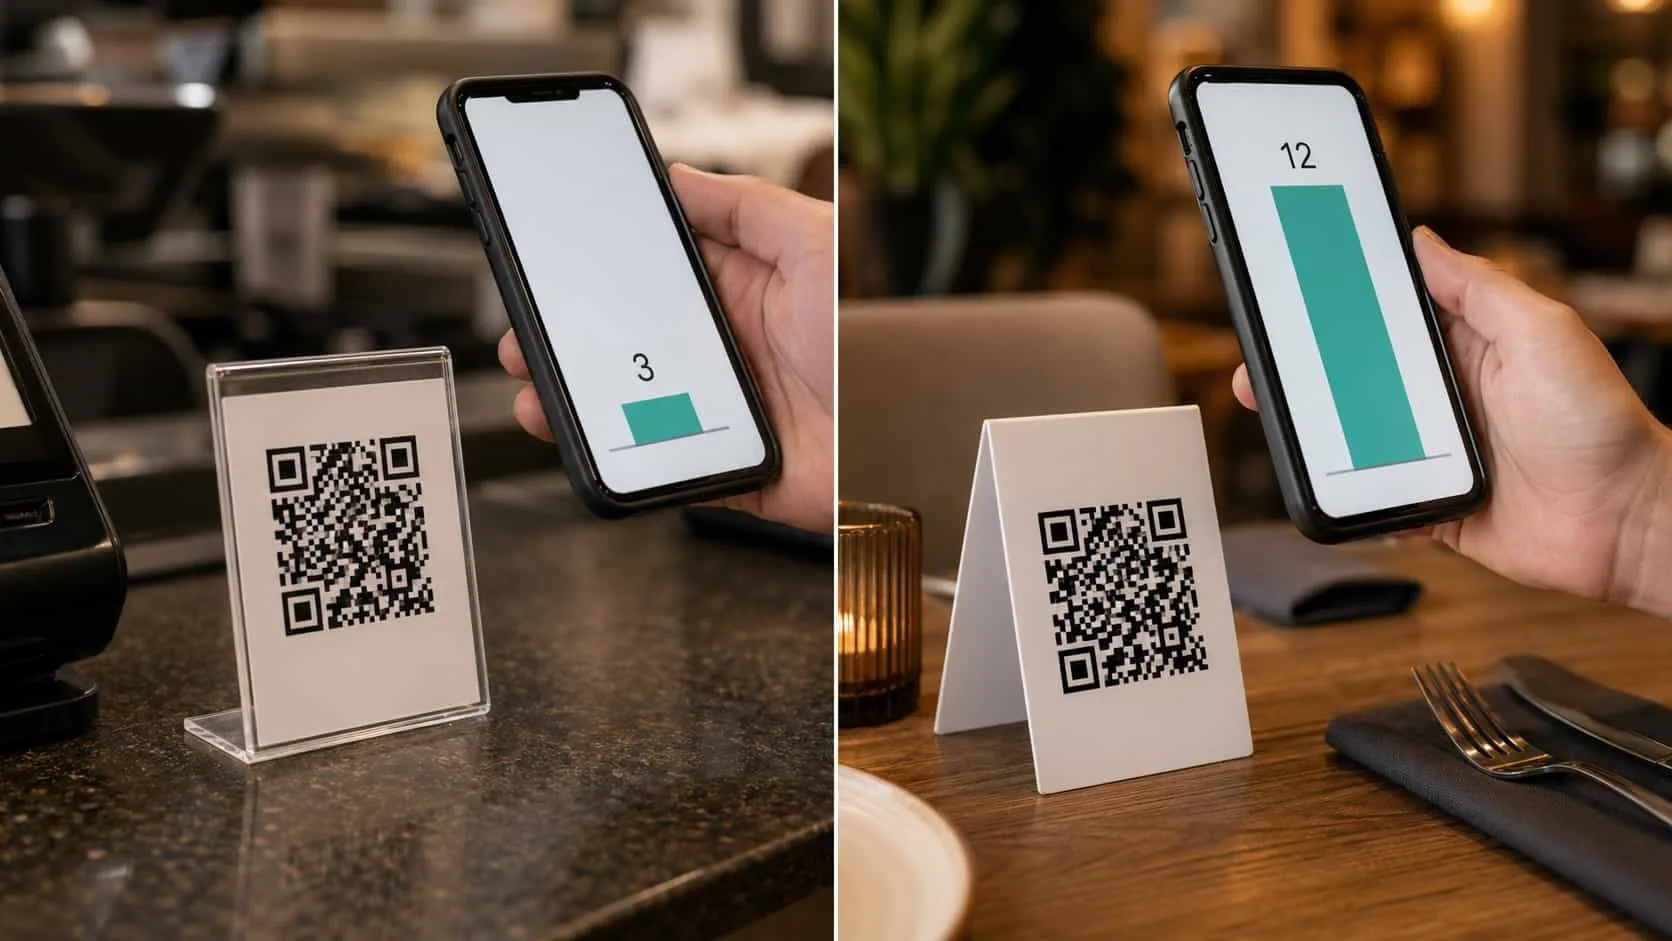
After seven days, compare the numbers. You will almost always find that one placement outperforms the other by 2x to 4x. MapLift documented this in restaurants. Table tent QR codes generated a 12% scan rate while receipt codes managed just 6%. That is a 2x difference from moving the same code three feet. In barbershops, mirror-station codes outperform checkout codes by 3x or more because clients stare at the mirror for 20 to 45 minutes and the code is in their field of vision the entire time.
The test does not have to be complicated. You are not running a controlled experiment with statistical significance. You are getting directional data that tells you whether to invest more in placement A or placement B. If your table tent gets 40 scans in a week and your receipt code gets 8, you do not need a data scientist to tell you the table tent is working better. Move the receipt code budget to printing better table tents. For detailed guidance on which spots work best, see our guide on best placement strategies.
Connecting QR Scans to Google Analytics Without a PhD
Your QR platform dashboard tells you about the scan. How many, when, from what device. Google Analytics tells you what happened after the scan. Did the page load, how long did they stay, did they complete the action. Connecting the two gives you the full picture, and it takes about five minutes to set up.
The connection is a UTM parameter, a small piece of text you add to the end of your destination URL before generating the QR code. It looks like this: your normal Google review URL, then ?utm_source=table_tent&utm_medium=qr_code&utm_campaign=review_may_2026. When someone scans the code and the review page opens, Google Analytics sees that visit tagged with those labels. You can then filter your GA4 traffic by source "table_tent" and medium "qr_code" and see exactly how many sessions came from that specific code.
Use different utm_source values for each placement. The table tent gets utm_source=table_tent. The receipt gets utm_source=receipt. The mirror sticker gets utm_source=mirror_station. Now you have two layers of data. Your QR platform tells you scan counts per code, and GA4 tells you post-scan behavior per code. Together, they reveal the complete scan-to-review journey. If the table tent shows 40 scans in your QR dashboard but GA4 only shows 25 sessions with that UTM tag, you know 15 people scanned but the page did not load. Probably a connectivity issue in that area of your business. That is actionable intelligence you would never have without both layers.
What Good Looks Like: Benchmarks by Business Type
Every business owner asks the same question. "Is my scan rate good?" The honest answer is that it depends on your business type, placement, and how often your staff mentions the code. But here are realistic benchmarks based on industry data so you have a reference point.
| Business Type | Good Scan Rate | Scan-to-Review Conversion | Reviews/Week Target | Best Measurement Window |
|---|---|---|---|---|
| Restaurant (table tent) | 10-15% of diners | 15-20% | 5-12 | Fri-Sun dinner service |
| Barbershop (mirror) | 15-25% of clients | 18-25% | 10-25 | Sat morning peak |
| Hair salon (mirror) | 10-15% of clients | 15-20% | 5-10 | Thu-Sat appointments |
| Dental/Medical clinic | 5-10% of patients | 12-18% | 3-8 | Weekday checkout times |
| Gym (exit door) | 8-12% of members | 10-15% | 5-15 | Post-class windows |
| Retail store (counter) | 3-6% of shoppers | 10-15% | 3-6 | Weekend afternoons |
A few things jump out from these numbers. Barbershops have the highest conversion rates because the mirror placement catches people at their emotional peak. They just saw the transformation and their phone is already out for a selfie. Clinics have lower scan rates but their reviews tend to be longer and more detailed, which Google weighs favorably. Gyms show high variance depending on whether the coach mentions the code at the end of class. A verbal prompt lifts scan rates from 3-4% to 8-12%. If your numbers are below these benchmarks, the first thing to check is not the code itself but whether anyone on your team is actually mentioning it. For physical business owners wanting a deeper approach, see QR code analytics for physical businesses.
The Weekly Review Rhythm That Compounds
Tracking is not a one-time setup. It is a weekly habit that takes ten minutes and compounds over months. Here is a simple rhythm that works for any business type.
Monday morning. Open your QR dashboard and check last week's scan counts by placement. Note which placement won and which underperformed. If one code got zero scans, walk over and check that it is still there, still visible, and still scanning properly. Physical codes get knocked over, covered by menus, or peeled off by cleaning staff more often than you would think.
Wednesday. Check your Google review count. Compare this week's new reviews to the scan count from your dashboard. If you had 30 scans and 5 reviews, your conversion rate is about 17%. Solid. If you had 30 scans and 1 review, something is wrong in the funnel and you need to investigate. Did the link break? Is the review page loading? Is Google requiring a sign-in that is scaring people off?
Friday before the weekend rush. Make sure your highest-performing placement is clean, visible, and stocked. If your Friday evening table tent generates 40% of your weekly scans, a crumpled or missing tent on Friday night costs you more reviews than a week of poor placement elsewhere. This ten-minute weekly rhythm produces more review growth than any one-time optimization because it catches problems early and compounds small improvements over time. Consistent review velocity, 2 to 4 new reviews per week, is a recognized local SEO ranking factor that improves your Google Maps positioning within 45 to 60 days.
Every Scan Tells a Story. Are You Listening?
VISU QR Ads tracks scans, devices, locations, and timing in real time. Compare placements, spot broken links, and see exactly where reviews are born, and where they die.
Frequently Asked Questions
What is a good scan-to-review conversion rate?
For a well-placed dynamic QR code with a clear call-to-action, 15 to 20% is solid. That means for every 100 scans, 15 to 20 people submit a review. Barbershops with mirror placements and a verbal prompt can hit 20 to 25%. If you are below 10%, the issue is usually not placement but the post-scan experience. A slow-loading page, a confusing Google sign-in screen, or a review form that feels like too much effort in the moment.
How often should I check my QR analytics?
Weekly is the sweet spot for most businesses. A Monday check on last week's scan counts, a Wednesday check on new reviews, and a Friday check to ensure your codes are ready for the weekend. During the first two weeks after placing a new code, check daily to establish a baseline. After that, weekly monitoring catches problems before they cost you more than a few reviews.
Do I need Google Analytics to track my QR codes?
No. Your QR platform's built-in dashboard handles the scan-level data. How many scans, when, from what device, from what location. Google Analytics adds a second layer: post-scan behavior like page load time, session duration, and whether the review was submitted. The QR dashboard alone is enough to make placement decisions and catch broken links. GA4 adds depth when you want to optimize the post-scan experience.
Can I track which staff member generates the most reviews?
Indirectly, yes. Create a separate QR code for each station. Each barber's mirror, each stylist's chair, each treatment room. The codes all point to the same review page but are tracked separately in your dashboard. The station with the most scans is the station where the staff member is doing the best job of prompting. This turns review tracking into a friendly internal competition that benefits everyone.
What if my scan numbers look good but reviews are not increasing?
This is the classic funnel gap. People are scanning but not completing the review. The most common causes: the review page requires a Google sign-in and the customer does not want to log in on the spot, the page loads too slowly on mobile, or the customer gets distracted between scanning and submitting. Test the full flow yourself on your own phone. Scan the code, log in, write a review, submit. Time it. If it takes more than 45 seconds or requires more than three taps, that is where your reviews are disappearing.
References
- Supercode: QR Code Tracking and Analytics — Complete 2026 Guide
- Bitly: QR Code Scan Benchmarks by Industry — Behavioral Patterns and Timing
- QRCodeKIT: QR Code Engagement Metrics — What to Track and Why
- MapLift: Google Review QR Code — Complete Guide and Free Generator
- BrightLocal: Local Consumer Review Survey (2026)