

An online store knows the exact moment a customer hesitated on the checkout button. A physical store has no idea why the person who walked in three minutes ago left empty-handed. That gap has been the unfair disadvantage of running a physical business for decades, and most owners have just accepted it. QR codes are the quiet little tool that finally levels the field. Not because they are flashy. Because they convert anonymous foot traffic into actual data you can read on your phone.
Most owners hear "QR code analytics" and picture a dashboard built for a marketing team at a Fortune 500. That is not what this is. The dashboards that matter for a small physical business are dead simple. How many people scanned, where they were standing when they did, what time of day, what device, and whether the page they landed on actually loaded. Five questions, answered in real time, on the same phone you already use to run the business. That is the entire toolkit.
Once you have those answers for even a single week, decisions stop being guesses. You stop ordering more table tents because last year worked fine. You stop printing flyers that nobody is engaging with. You stop putting QR codes in spots customers can't see from where they sit. The data does not tell you what to do, but it shows you which questions are worth asking, and that is the part most physical businesses have never had.
Stop Running Your Business on Guesses
VISU QR Ads turns every printed surface into a measurable channel. See scans in real time, by location, by device, by hour. The data was always there. Now you can read it.
The Data Gap That Made Physical Business Feel Unfair
For twenty years, ecommerce has been quietly winning a battle that most physical business owners did not even know they were in. Not on price, not on convenience, but on visibility into what customers do. An online store sees every page view, every cart abandonment, every minute of hesitation. The owner of that store wakes up and reads a dashboard that tells them exactly which products people looked at, which they almost bought, and which never got a single click. That feedback loop is how online businesses optimize their way to dominance, week after week, while the physical store down the street keeps doing what worked last year because there is no data to suggest otherwise.
The asymmetry is not about effort or smarts. It is about measurement. A physical store has always had every signal an online store has, just trapped inside the building. Customers walk past displays, hesitate, choose, leave. Staff have hunches but cannot prove them. Owners have intuition built over years but cannot stress-test it against numbers. The information is there in the air every day. There just has not been a cheap way to capture it.
QR codes change that, not because of the codes themselves, but because every scan is a data point. The customer voluntarily picked up their phone, pointed it at something in your space, and your platform recorded that interaction. Multiply that across hundreds of customers a week and you suddenly have something that looks a lot like the kind of data ecommerce has had all along. Foot traffic stops being invisible. For the broader picture of how this fits into measuring what matters, our piece on QR code tracking walks through the mechanics.
The Five Numbers That Actually Matter
Most QR analytics dashboards drown owners in metrics that do not change any decision. Total scans, unique scans, devices, locations, browsers, operating systems, peak hours, and a chart for every cross-section. It looks impressive and it teaches you almost nothing on its own. The trick is to ignore most of it and watch only the numbers that map to a decision you can actually make this week.
Total scans by code. The simplest metric and still the most powerful. If your table tent code got 47 scans and your receipt code got 8, you do not need a statistician to tell you the table tent is doing the work. Move budget there. The whole "make decisions with data" thing starts with this one number, and most businesses never even look.
Unique scans vs total scans. Total counts every scan event. Unique counts individual devices. If those two numbers are close, you are reaching different people. If the total is much bigger than unique, the same handful of customers are scanning over and over without converting, which is a different problem entirely. This single ratio tells you whether your visibility is working but conversion is broken, or your visibility is the bottleneck.
Time-of-day pattern. When are scans actually happening? If 40% of your weekly scans land Friday between 6pm and 8pm, that is your prime window. Make sure the code is clean, visible, and stocked at that exact moment. If your busiest hour produces almost no scans, the code is invisible during the part of the day that matters most.
Device split. Mostly iPhone, mostly Android, or roughly even? This matters because your destination page needs to render flawlessly on whatever phone is in front of you. An 80% iPhone audience means Safari rendering is the only test that counts. A 50/50 split means you test both, and you treat any browser-specific bug as a real revenue problem.
Page-load success rate. The most ignored metric and one of the most important. A scan that does not result in a loaded page is wasted. If your dashboard shows 30 scans but Google Analytics shows 22 sessions, eight people scanned and got nothing, which usually means a connectivity dead zone or a broken redirect. These are the kinds of engagement metrics that matter, the ones tied to a fix you can actually make.
How to Read Your Dashboard Without Drowning in Charts
The right way to use a QR analytics dashboard is the way you use a car dashboard, not the way you use a spreadsheet. You glance, you check whether anything is off, and you go back to running the business. If reading the dashboard takes more than two minutes, you will stop reading it within a month, and the whole tracking layer becomes shelfware. Build the habit around speed.
Here is the practical glance routine. Open the dashboard. Look at the total scans for the past seven days. Look at scans by code, sorted highest to lowest. Look at the time-of-day pattern. If anything looks meaningfully different from last week, dig in. If everything looks normal, close the app. That is the whole exercise. Total time, around ninety seconds.
What counts as "meaningfully different" is a number that surprises you. A code that suddenly went from 40 weekly scans to 4 is broken or moved or covered. A code that doubled means something good happened, often a staff member started mentioning it, and you want to figure out what changed so you can keep it going. Boring weeks are the goal. Boring means the system is steady. The week you should pay close attention is the week the dashboard surprises you.
Turning Placement Into a Repeatable Experiment
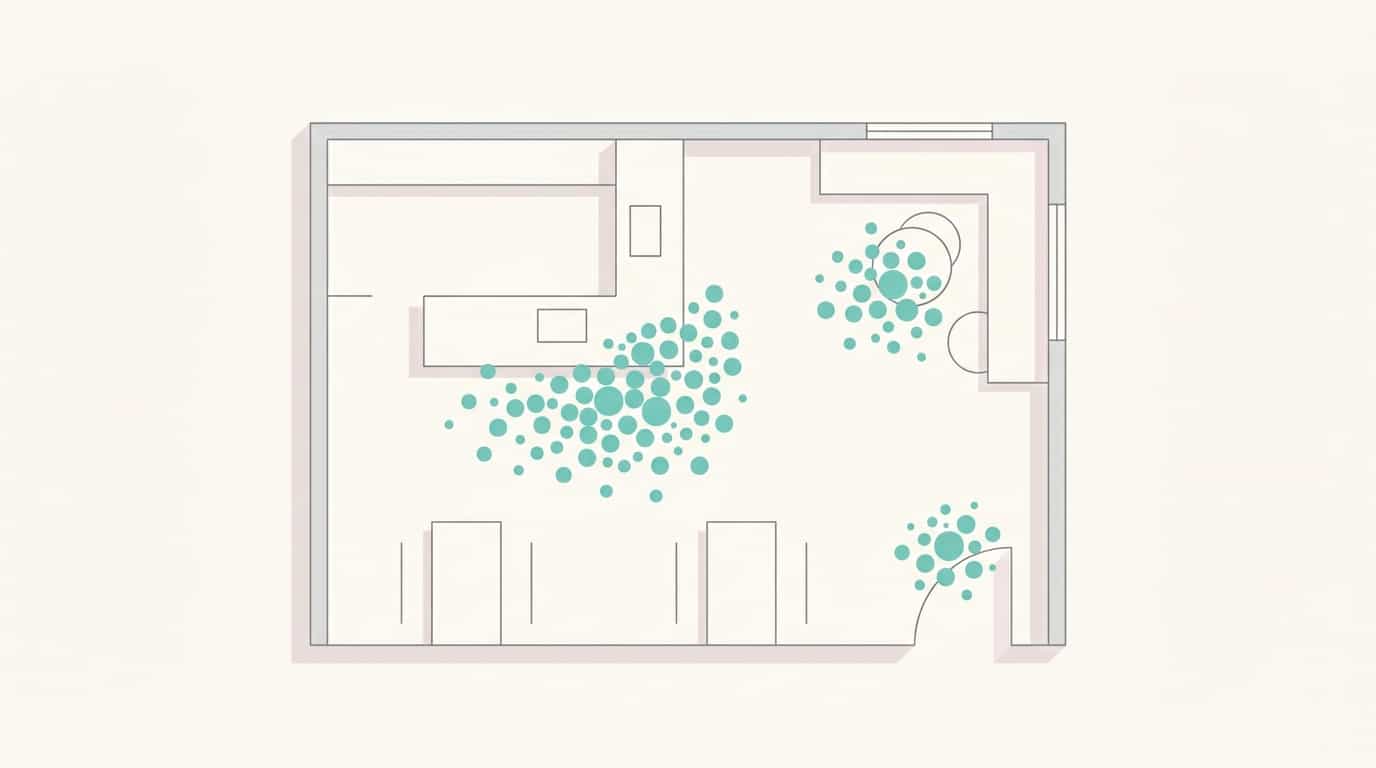
The single most underused thing about QR code analytics is using them to run real placement experiments. Not theory, not best practices from a blog, your own data from your own customers in your own space. The setup is so simple that owners often skip it because it feels too easy to be useful. It is not. It is the highest-yield use of your dashboard for the first six months.
Pick two spots in your business that you have a question about. Maybe table tent versus receipt. Maybe mirror versus reception desk. Maybe entrance versus exit. Generate two dynamic codes, give them clear names tied to their physical location, and place one in each spot. Same artwork, same destination, same incentive language. You are not testing the message. You are testing the location.
Wait seven days. Open the dashboard, look at the scan counts side by side. The result will almost always be lopsided, sometimes dramatically. The winning placement is your new default. Move the losing code's budget into producing better materials for the winning spot. Then pick the next question and run the next test. You can do this forever. Most businesses get more than half their conversion lift in the first six tests, just by stopping the spend on placements that customers ignore.
For physical businesses with real foot traffic, this kind of testing is usually impossible without a tracking layer because there is no way to measure foot traffic at a placement-level granularity. QR codes give you that granularity for free. For more on the broader practice of using offline scans as a real-time signal, see our piece on tracking real-time engagement offline.
Run the Test. Read the Numbers. Move the Code.
VISU QR Ads makes placement experiments a one-day project, not a quarter-long initiative. Two codes, seven days, a clear winner.
Time Patterns: When Your Business Actually Performs
Owners think they know when their business is busy. They are usually right about overall foot traffic and usually wrong about when customers are actually receptive. Foot traffic peaks and engagement peaks are not the same hour. The line at the register on Saturday at noon is not when people are scanning, because nobody scans while waiting in line. The 8pm Friday dinner crowd is when the scans hit, because that is when customers are sitting still, satisfied, and have their phone in hand.
Once you can see the time pattern in your data, two things change. First, you start noticing windows you did not know existed. A barber shop might assume Saturday is the peak, then find out that the slow Tuesday afternoon block is actually the highest-converting hour because clients are relaxed and chatty. A restaurant might find that early Friday dinner converts better than late Friday because nobody is rushing. The patterns are specific to your business.
Second, you start running the business around those windows instead of guessing about them. The high-converting hour is when the QR code needs to be visible, the staff needs to be mentioning it, and the team needs to be paying attention. If your peak window is Saturday morning and your code is hidden behind a flower vase that the cleaning staff put there Thursday night, you just lost your best window of the week. Time-of-day data turns that from "wow, that's unfortunate" into "fix it before Saturday."
Funnel Thinking for Physical Businesses
Online stores live by funnel thinking. View, click, add to cart, checkout, purchase. Each stage has a number, and the gap between two stages is where the optimization happens. Physical stores almost never think this way because they cannot measure the intermediate stages. QR codes change that for the parts of the experience that touch a phone, and those parts are where most modern customer behavior actually happens.
The basic physical-business funnel looks something like this. A customer enters your space. They notice the QR code. They scan it. The destination page loads. They take an action on the page (review, booking, signup, purchase). Each step has a drop-off, and your dashboard makes most of those drop-offs visible. Foot traffic to scan ratio. Scan to page-load ratio. Page-load to action ratio. Each ratio is a place where you can either accept the loss or do something about it.
This is exactly how online stores have been optimizing for two decades. The mechanics are the same, the tools are different. For a specific deep dive into one of these funnels, our piece on how to track review QR code performance walks through the scan-to-review version of this thinking, and the same logic applies to bookings, signups, menu views, or any other destination you point a code at.
A Ten-Minute Weekly Rhythm That Compounds
Owners do not fail at QR analytics because the data is hard. They fail because they treat it as a one-time setup instead of a habit. A dashboard you check once and forget produces zero compounding value. A dashboard you check for ten minutes a week, every week, slowly turns your business into a system that gets better month over month. The difference is not effort. It is rhythm.
Monday morning, three minutes. Open the dashboard. Look at last week's totals by code. Note which placement won, which one underperformed, and whether anything looked broken (zero scans on a code that normally gets some, or a sudden drop). If you see a problem, walk over and check the physical code that afternoon. Most "the code is broken" issues are physical, not technical.
Wednesday, two minutes. Glance at the time-of-day pattern from the past week. Is it consistent with previous weeks? Is your peak window producing the scans you would expect? If a normally busy hour is suddenly quiet, something changed in the experience and you want to find it before the weekend.
Friday before the weekend rush, five minutes. Walk through your space, sit where customers sit, and try to scan every code from the customer's seat. Make sure each one is clean, visible, and accessible. If the highest-performing placement is crumpled or covered, fix it now. The Friday-evening through Sunday-afternoon block is usually where the bulk of your scans happen, and a bad code there costs more than a bad code anywhere else.
Total weekly investment, ten minutes. Compounded over a year, that is forty real changes you would not have made without the data, and most of them are tiny. Move a code two feet. Replace a faded sticker. Update a destination page that was timing out. None of these decisions feel huge in the moment. The cumulative effect is a measurable lift in scan volume and scan-to-action conversion that you would not have gotten any other way.
Privacy and What the Data Actually Says (and Does Not)
QR code analytics are not surveillance. They are aggregate behavioral signals that look a lot like the kind of data any website has been collecting since 1996. A scan tells you that someone with an Android phone, somewhere near your address, scanned a code at 7:43pm. It does not tell you who they are, what their name is, or anything personally identifying. The same way Google Analytics works for websites, but for the physical surface of your business.
That said, modern dynamic platforms do let you collect more if you want to. If your destination page asks for an email or a phone number, that is a real data collection event, and it is governed by data protection laws like LGPD in Brazil and GDPR in the EU. The scan itself is not the issue. What you do on the destination page is. Be honest about what you are collecting, why, and how you will use it. If you are not collecting personal information, your QR analytics are about as privacy-sensitive as counting how many cars pass your storefront. Aggregate, anonymous, and useful for running the business.
For the deeper dive into combining QR scans with on-site data collection in compliant ways, our guide on how to collect customer data in physical stores walks through the practical setup. The short version: keep the scan layer simple and aggregate, and treat anything that touches a name, email, or phone with the seriousness those things deserve.
Frequently Asked Questions
How accurate is QR code location data?
Location accuracy from a QR scan is approximate, usually at the city or neighborhood level, not a precise GPS pin. The platform infers location from the scanner's IP address, which is roughly where their network connection sits. For a single physical business this is fine because you already know where the code is. The location data becomes much more useful when you have multiple locations and want to see which one is generating scans.
What if my QR code shows lots of scans but no business growth?
That is a funnel problem, not a visibility problem, and it is the most useful kind of insight. Scans without growth means the destination page or the next step is broken, slow, or not compelling enough. Test the full path on your own phone, time it, and look for friction points. The data already told you what is working (the scan part) and what is not (everything after).
Do I need Google Analytics on top of my QR code dashboard?
Not for most small businesses. The QR dashboard handles scan-level data, which is what drives placement and timing decisions. Google Analytics adds depth on the destination page, like time on page, scroll depth, and conversion events. If you are running a basic local business, the QR dashboard alone is usually enough. If you are optimizing the post-scan experience deeply, layering Google Analytics adds value.
How long until I have enough data to make decisions?
For placement comparisons, seven days of normal traffic is usually enough to see clear patterns. For time-of-day patterns, two to three weeks. For seasonal patterns, a full quarter. The good news is that the most actionable decisions, like which placement is winning or which code is broken, show up in the first week. Early data is rough, but rough data is still better than zero data.
Can I see scan data for codes I created months ago?
Yes, on most dynamic QR platforms. Historical scan data stays attached to the code for the life of the subscription, regardless of whether you have edited the destination since. This means you can see how a code performed during a specific campaign, then how it performed after you changed the destination, in one continuous timeline.
Foot Traffic Is a Signal. Read It.
VISU QR Ads turns scans into a dashboard you actually look at. Real-time, mobile-first, and built for the way physical businesses really run.