

Only 15% of satisfied restaurant customers leave a review without being prompted. The other 85% enjoyed the meal, maybe told a friend, and moved on. Meanwhile, the competitor across the street with worse food but a QR code on every table is collecting 67 reviews a month and climbing Google Maps rankings. One restaurant chain added 4x6 inch table tents with a Google review QR code at every table. In 90 days they went from 12 reviews per month to 67. That is a 458% increase from a single printed card.
Restaurants have an advantage that no other business type can match for review collection. Your customers are seated, relaxed, phones already in hand, and experiencing peak satisfaction right after a great meal. That 5 to 10 minute window after the last bite is the most valuable moment in your entire review strategy, and most restaurants let it pass without capturing a single word. The QR code turns that moment into a published review.
This guide covers the exact placements, server scripts, timing windows, and design specs that drive results. Everything is based on real data from restaurants that implemented these strategies and measured what happened.
Turn Every Table Into a Review Machine
VISU QR Ads gives restaurants dynamic, trackable QR codes with real-time analytics. See which tables drive the most reviews. Adjust without reprinting.
Why Restaurants Benefit More From Review QR Codes Than Any Other Business
Restaurants have three structural advantages for QR code review collection that other businesses cannot replicate. First, the post-meal satisfaction peak. Hospitality research shows customer satisfaction scores are 34% higher when measured within 15 minutes of service completion compared to follow-up surveys sent 24 hours later. The diner who just finished an excellent steak is emotionally ready to write about it right now, not tomorrow.
Second, restaurants are full of physical touchpoints where customers are stationary with phones out. Tables, menus, check presenters, receipts, and counter surfaces all represent moments where a QR code can intercept attention without disrupting the experience. A customer sitting at a table for 45 to 60 minutes has multiple exposure windows to notice and scan a code.
Third, the competitive pressure is intense. BrightLocal data shows that top-3 ranking restaurants on Google Maps average over 250 reviews while the median restaurant sits at just 39. If your competitor has 180 reviews and you have 65, they are probably outranking you regardless of food quality. Review signals now account for approximately 20% of local search ranking weight, and review velocity (how often you get new reviews) jumped from factor #93 to #11 in recent industry surveys. QR codes systematically close this gap by converting satisfied diners into reviewers at scale.
The financial impact is direct. Research links an 18% revenue increase to consistent positive review growth, and a one-star rating improvement correlates with a 44% increase in foot traffic. For a restaurant earning $30,000 monthly, even a conservative 10% lift from better reviews means $36,000 in additional annual revenue from a strategy that costs less than $100 to implement. For the full picture on attracting new diners, see our guide on how to get more customers for your restaurant.
1. Table Tent and Table Edge: The Highest-Performing Placement
Scan rate: 12% for review codes, up to 78% for menu codes at table edge
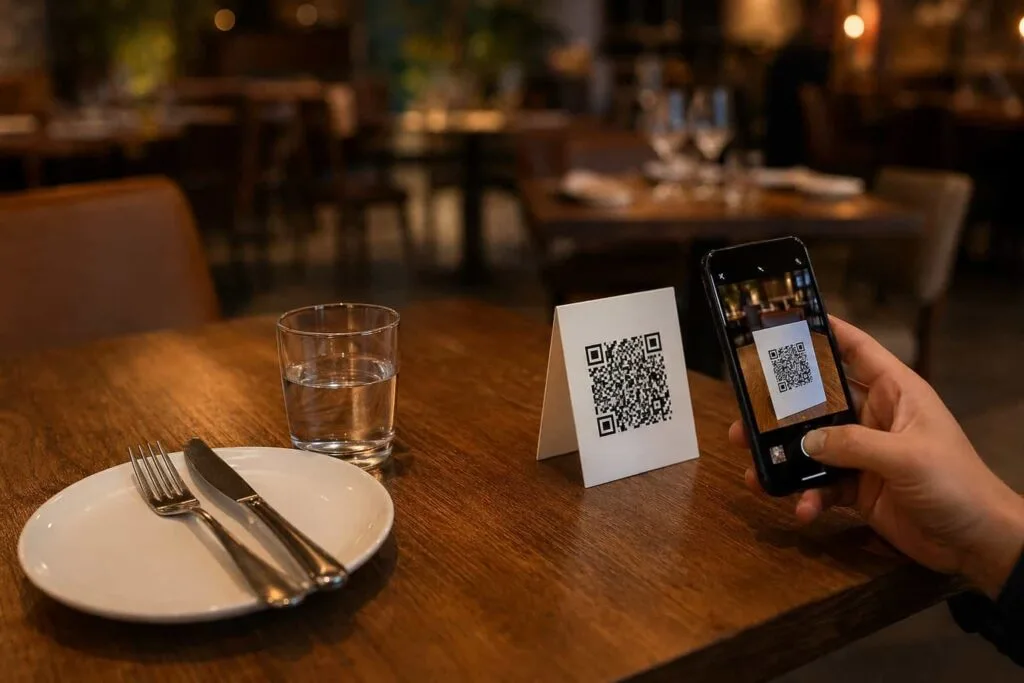
Table tents are the highest-performing physical placement for review QR codes in restaurant environments. A chain in Hyderabad added 4x6 inch table tents to every table and went from 12 reviews per month to 67 in 90 days. 43% of those new reviews mentioned their signature dish by name, and 38% mentioned "family-friendly," both keywords that boosted their local search ranking from #8 to #3 for "best biryani restaurant near me."
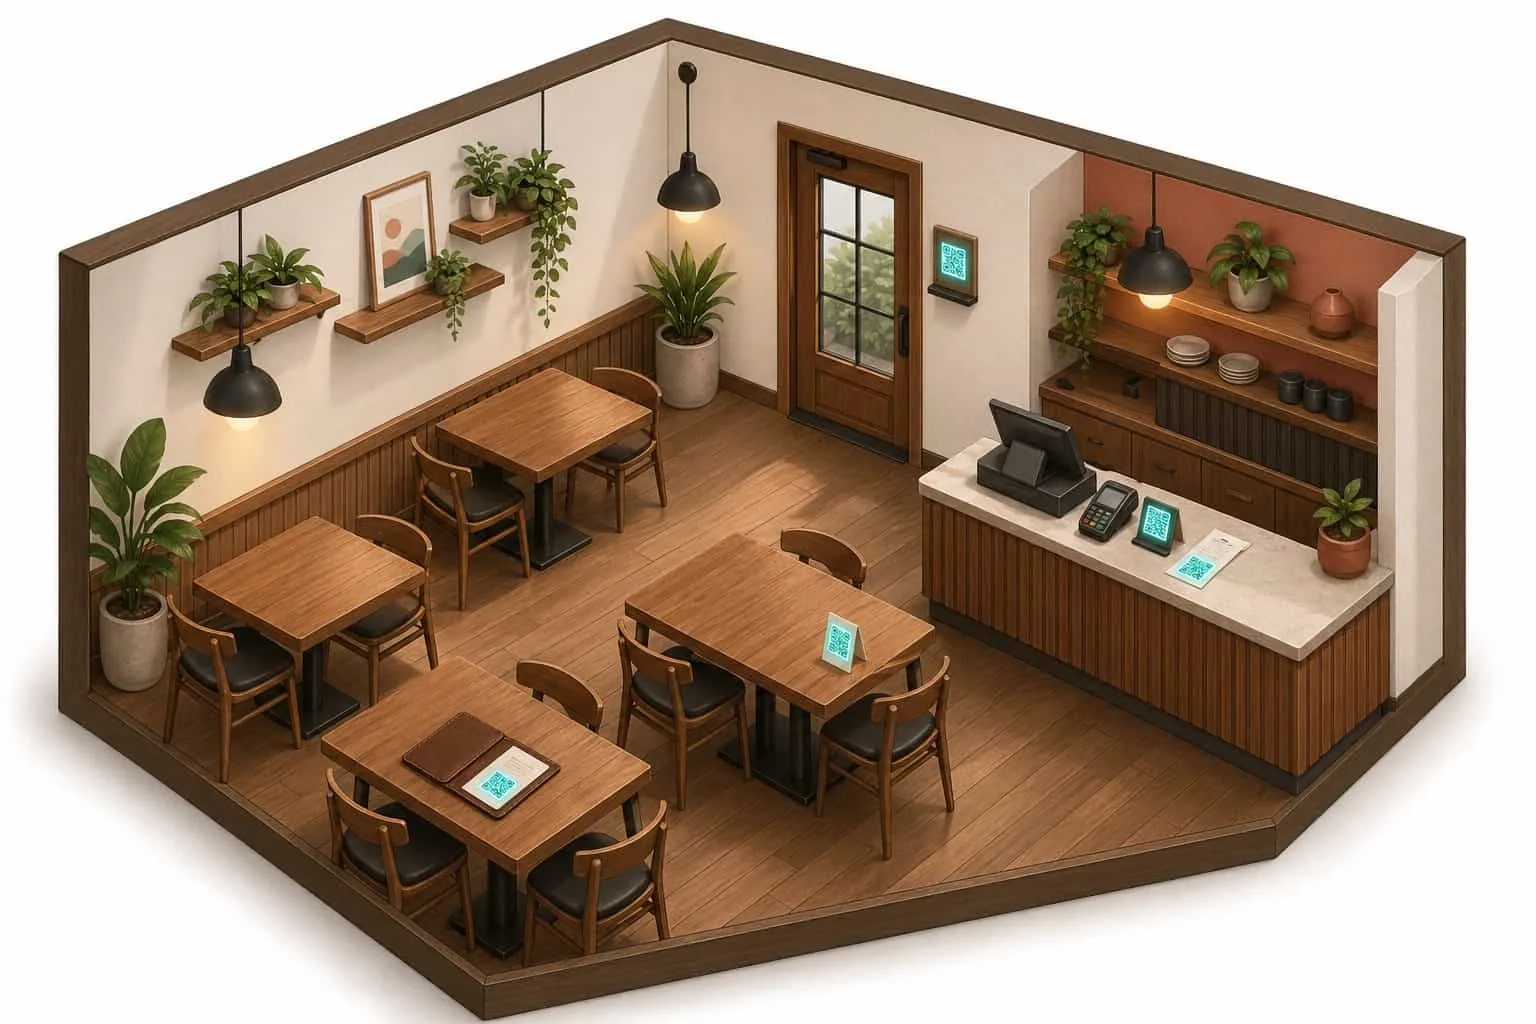
Placement on the table matters. Data from 10,000 restaurants analyzing 2 million scans shows table edge placement achieves 78% scan rates versus 62% at table center. Edge placement keeps the code in the diner's natural sight line without blocking conversation or getting knocked over when food arrives. For 4-top tables, right edge placement hits 82% while left edge reaches 74%. For bar seating, center placement actually outperforms at 84% because there is no across-table conversation to block.
The physical specs that work: 4x6 inches for standard tables (5x7 for larger ones), 300gsm card stock minimum so it stands upright without support, matte lamination to reduce glare and improve scannability, QR code at least 3x3 inches for visibility from 3 to 5 feet. Print the code on both sides of the tent so it is visible from all angles. Add a single clear line: "Loved your meal? Scan to review us on Google." That text alone nearly doubles scan rates, from 39% without any label to 73% with one.
Peak scan times from testing across 40+ restaurants: 15% of scans happen 3 to 7 minutes after ordering (while waiting for food), 45% during the dessert or coffee phase, and 40% while reviewing the bill. The tent should be present throughout the entire meal, not brought only with the check. For detailed guidance on optimizing every placement spot, see where to place a review QR code.
2. Check Presenter: The Hidden Champion
Scan rate: 15-18% for review codes
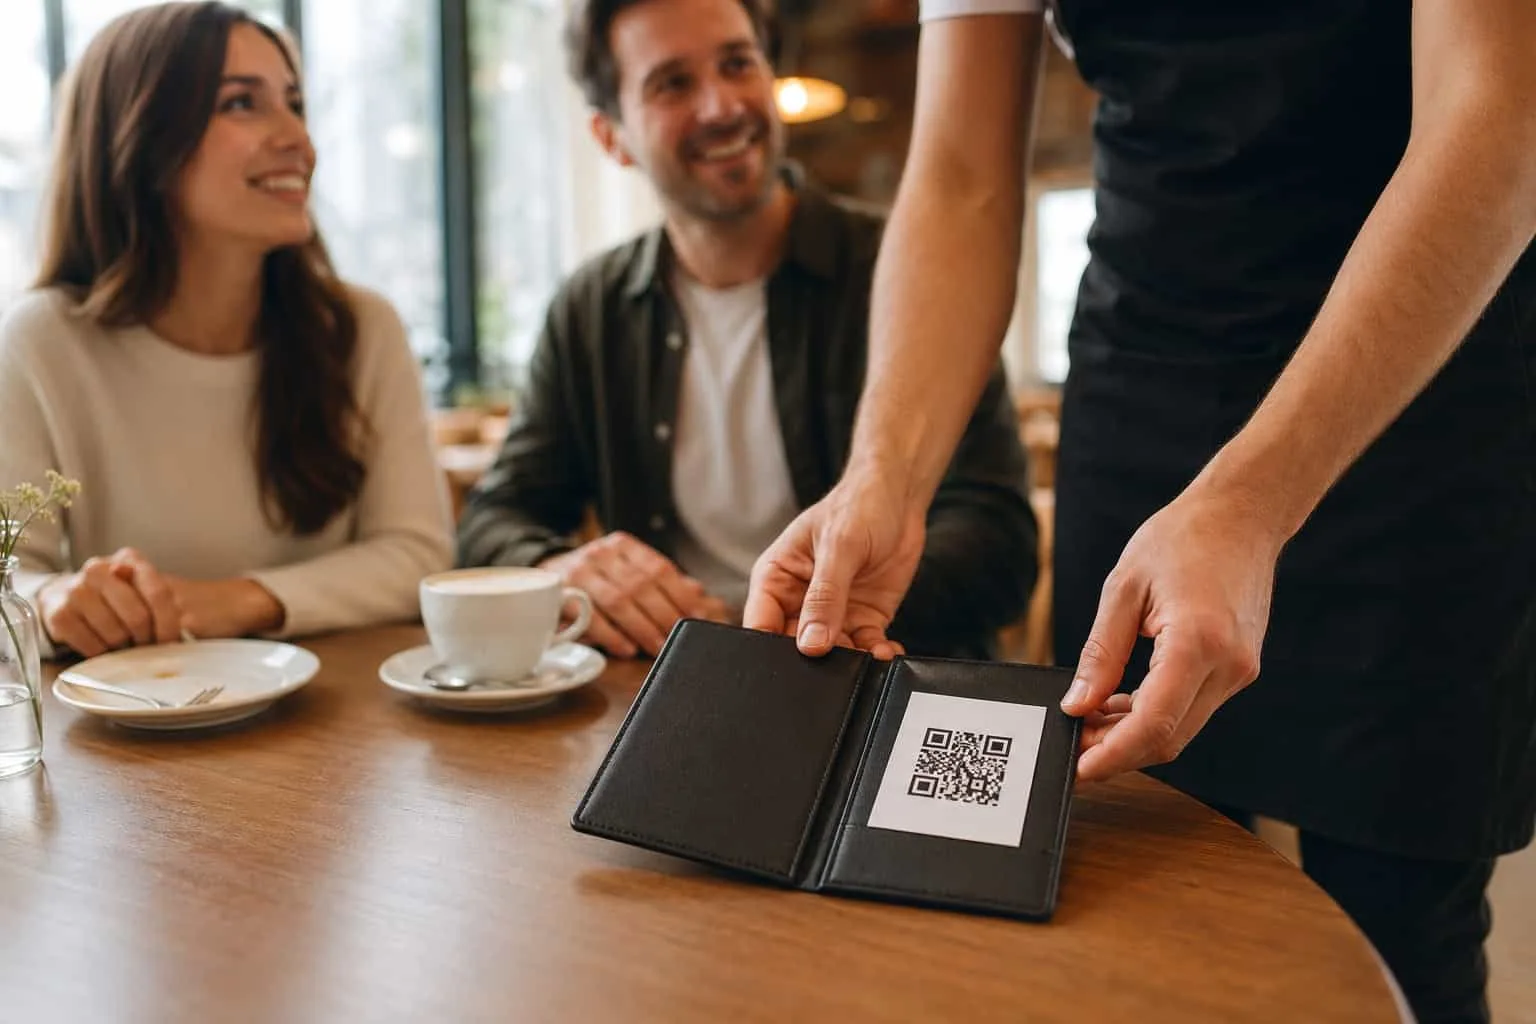
The check presenter is the single highest scan rate placement for review-specific QR codes in full-service restaurants. It outperforms table tents for one reason: timing. When a diner opens the check presenter, their phone is already out for payment, they have 2 to 3 minutes of stationary attention, and they are in a reflective state about the overall experience.
Implementation can be high-end or budget-friendly. Custom leather or vinyl presenters with a QR code panel built into the inside cover look professional and are reusable. The budget approach works equally well: print 4x6 inch card inserts and slip them into your existing presenters. The card sits face up when the presenter is opened, QR code visible and ready to scan. Cost per card: roughly $0.10 to $0.15.
A fine dining restaurant in Bangalore placed QR codes exclusively inside check presenters and trained servers to mention the code during bill drop. In 60 days, reviews jumped from 19 per month to 81 (a 326% increase), the star rating rose from 4.2 to 4.6, and reservation requests increased by 52%. The critical detail: 28% of the new reviews mentioned the chef by name and 34% mentioned "fine dining Bangalore," keywords that directly improved their visibility in local searches.
3. Receipts: The Review Reminder That Goes Home
Scan rate: 6-8% for review codes
Receipt QR codes have a lower in-the-moment scan rate than table tents or check presenters, but they have a unique advantage: they leave the restaurant with the customer. A receipt sits in a pocket or on a kitchen counter at home, extending the review window by 24 to 48 hours. For customers who intended to review but did not scan at the table, the receipt provides a second opportunity.
Print the QR code at the bottom of the thermal receipt after the total, with a single line: "Review us on Google." The minimum printable size on thermal paper is 2x2 cm, which is small but functional for close-range scanning. The real power of receipt QR codes shows in high-transaction environments. A fast-casual chain in Mumbai with 6 locations added QR codes to every receipt and saw reviews jump from 34 per month to 197 across all locations, a 480% increase. High transaction volume means even a 6% scan rate generates substantial review volume.
For dine-in, pair the receipt code with a table tent or check presenter. The receipt becomes the backup, not the primary. For takeout and delivery, the receipt or packaging insert becomes the primary touchpoint because there is no table or server interaction.
One QR Code. Every Placement.
VISU QR Ads generates one dynamic code that works on table tents, check presenters, receipts, and packaging. Update the destination anytime. Track scans per placement.
5. Exit Door and Takeout Packaging
Scan rate: 8-12% at exit, 4-8% on packaging
The exit door is the last physical touchpoint before the customer leaves your restaurant. A wall-mounted display or acrylic stand at eye level next to the door catches the 3 to 5 second pause as diners push the door, grab coats, or say goodbye. The CTA here should feel like a farewell: "Thanks for dining with us! Scan to tell us how we did."
For takeout and delivery, the packaging insert is the only physical touchpoint with the customer. A small card (2x3 inches) inside the bag with a QR code captures the customer during the unboxing moment at home. A cafe chain in Pune put QR stickers on takeout cups and saw reviews jump from 41 per month to 168 (a 310% increase). 29% of the new reviews mentioned "work-friendly," a keyword that attracted a new customer segment they had not specifically targeted.
Delivery has the lowest engagement for reviews (3 to 5% scan rate) because there is no face-to-face rapport. Focus your primary effort on dine-in and takeout, where scan rates and review quality are significantly higher. The delivery insert is a bonus, not the foundation of your strategy.
Server Scripts That Boost Scan Rates by 40%
Placing QR codes without server involvement leaves the majority of potential reviews on the table. A restaurant chain in Delhi trained servers to mention the QR code during bill drop and saw scan rates increase from 8% to 12%, a 40% improvement from a 10-second interaction. The verbal prompt transforms a passive display into an active invitation.
Three scripts that test well across different restaurant formats. For casual dining during bill drop: "Here's your check, and if you enjoyed your meal, we'd love if you could scan this code to share your experience on Google. Takes 30 seconds and really helps us." For after payment with a gratitude tone: "Thank you so much! If you have a quick moment, scanning this code to leave a Google review would really help our small business." For regular customers with a community angle: "So glad you enjoyed it again! Would you mind scanning our QR code? We're trying to help more people discover us."
What to avoid: asking "Would you be willing to leave a review?" (gives an easy out), asking for a specific star rating (sounds coercive and may violate platform guidelines), and saying "We really need reviews" (focuses on your need, not the customer's contribution). Frame the request as helping other diners discover great food. Mention the code is "right there on the table" and takes "30 seconds." Train servers to read the table first: only ask customers who are visibly satisfied. For more on building repeat business from these interactions, see how to make customers come back.
The 30-Minute Window: Why Timing Changes Everything
Customer satisfaction recall is highest within 30 minutes of service completion. After 2 hours, specific details like dish names, server interactions, and ambiance descriptions fade by 40%. After 24 hours, 75% of customers who intended to review forget entirely. The reviews you capture in the moment are not only more likely to happen; they are richer in detail, longer in length, and packed with the specific keywords that improve your search ranking.
This is why in-restaurant QR codes outperform follow-up emails and SMS for review quality. A diner scanning at the table writes "The butter chicken was perfectly spiced and the naan was fresh out of the tandoor." The same diner responding to an email the next day writes "Good food, nice place." The first review contains keyword-rich content that tells Google exactly what your restaurant offers. The second adds no search value.
Timing differs by service type. For dine-in, the QR code scan at the table is the primary capture point (12% scan rate), with an SMS follow-up 30 minutes after departure as backup (18% review completion rate for those who receive it). For takeout, a receipt or bag insert works within 2 hours while the food is still being consumed. For delivery, an SMS 60 minutes post-delivery gives the customer time to eat before asking for feedback, though engagement is lower (3 to 5%).
Review Velocity: Why Steady Beats a Burst
Google's local algorithm has shifted significantly toward review velocity, the rate at which new reviews arrive, over total review count. Recent industry surveys show review velocity jumped from ranking factor #93 to #11. A business with 500 old reviews but zero new activity in 3 months will be outranked by a competitor with 150 reviews that receives 3 to 4 per week consistently.
This is important for QR code strategy because it changes the goal. You are not trying to generate a one-time burst of 50 reviews in a weekend promotion. You are trying to build a system that produces 2 to 4 new reviews per week, every week, indefinitely. That steady velocity signals to Google that your business is active, relevant, and consistently satisfying customers.
QR codes are the ideal tool for this because they are always on. The table tent does not take a day off. The check presenter prompts every single diner. The receipt code catches the spillover. Combined with server training, this creates a review generation engine that runs without requiring any ongoing campaign management. The challenge is not launching the system; it is maintaining the physical materials (replace laminated tents every 6 to 12 months) and keeping server training fresh (a quick 5-minute refresher every month). Explore how VISU for restaurants automates this with dynamic codes and real-time dashboards.
Placement Comparison Table
| Placement | Review Scan Rate | Best For | Cost | Key Advantage |
|---|---|---|---|---|
| Check presenter | 15-18% | Full-service, fine dining | $0.10-0.15 per insert | Phone already out, reflective moment |
| Table tent (edge) | 12% | All dine-in formats | $0.50-2.50 per tent | Multiple exposure across entire meal |
| Exit door display | 8-12% | All formats with separate exit | $3-5 acrylic stand | Last touchpoint, farewell moment |
| Receipt bottom | 6-8% | Fast-casual, QSR, takeout | $0 (POS integration) | Goes home, extends review window |
| Menu (insert or page) | 4-6% | All dine-in formats | $0.10 per insert | Plants seed early in the meal |
| Takeout packaging | 4-8% | Takeout, delivery, cafes | $0.05-0.10 per sticker | Only physical touchpoint for off-premise |
From 12 Reviews to 67. Your Turn.
VISU QR Ads gives your restaurant dynamic, trackable QR codes for every table, check presenter, and receipt. Real-time dashboard. No reprinting when you change campaigns.
Frequently Asked Questions
How many reviews per month should a restaurant aim for?
The median restaurant has 39 Google reviews total. Top-3 ranking restaurants average 250 or more. The goal is not a specific total but consistent velocity: 2 to 4 new reviews per week. At that pace, you add roughly 10 to 15 reviews per month and 120 to 180 per year. With a QR code system on table tents and check presenters plus server training, restaurants in case studies reached 45 to 80 new reviews per month.
Will QR codes lead to more negative reviews?
Data from restaurant implementations shows 87% of reviews collected via QR codes are positive (4 to 5 stars), 7% are neutral (3 stars), and only 6% are negative. QR codes favor positive reviews because satisfied customers are stationary, relaxed, and engaged at the table. Unhappy customers typically leave immediately without scanning. Having 200 reviews at a 4.5 average ranks better than 40 reviews with a perfect 5.0, which looks suspicious and lacks social proof.
Do I need a different QR code for each restaurant location?
Yes. Each location has a unique Google Business Profile and review URL. A customer at your downtown location scanning a code that points to your suburban location's review page sends the review to the wrong profile. Generate a separate QR code for each location, keep the design template identical, and add the location name to the table tent to prevent mix-ups during printing.
How long until I see results after adding QR codes?
Week 1 to 2 brings an initial boost of 2 to 4x normal review rate as early adopters scan. Week 3 to 4 sees the rate stabilize at roughly 1.5 to 2x baseline. By month 2 to 3, the rate reaches a sustained 3 to 4x baseline. Google Maps ranking improvements typically appear 45 to 60 days after implementation as the algorithm processes increased review volume and velocity.
Can Google penalize my restaurant for collecting reviews via QR codes?
Google does not prohibit QR codes for review collection. However, Google has flagged "review bursts" where many reviews arrive from the same location in a very short window, which can trigger a temporary posting suspension. The QR code approach naturally avoids this because reviews trickle in across service hours, days, and weeks rather than arriving in a single batch. Aim for steady daily collection rather than a weekend blitz.