

The proof business leaders need
Every serious marketing conversation ends with the same question: What is our ROI? Traditional channels struggle to answer it. Billboard impressions are vague. Social media reach is inflated. Store traffic attribution is guesswork. Because attention has real value, businesses need platforms that can measure and reward it directly.
Business leaders are tired of paying for attention they cannot measure. That is why they move to attention economy platforms like VISU—not for hype, but for verifiable financial results.
This collection brings together outcomes from VISU campaigns in retail, hospitality, fitness, events and book retail. You will see:
- Engagement rates between 17 percent and 28 percent instead of 2 to 5 percent.
- Customer acquisition costs cut by 40 percent to 72 percent.
- Lifetime value lifts of almost 2x for VISU users vs non users.
- ROI between 1,200 percent and 5,000+ percent in 60 to 90 days.
You can use these numbers directly in your own business case deck. If your team wants more context on consumer-facing apps in this category, see our guide to apps that pay real money.
This is the proof behind the pitch. Five real businesses in different industries, all using VISU to pay customers for attention and getting measurable ROI in return.
See the ROI for yourself
Do not guess. Launch a VISU campaign, track every scan and visit, and compare revenue before and after.
- The proof business leaders need
- Case Study 1: Local coffee shop chain
- Case Study 2: Regional event company
- Case Study 3: Boutique fitness studio
- Case Study 4: Local restaurant group
- Case Study 5: Retail bookstore chain
- Comparative analysis and key learnings
- ROI calculation framework
- Implementation roadmap
- FAQ

Case Study 1: Local coffee shop chain
Result: 23 percent engagement rate and 47 percent customer retention increase
Business profile and challenge
Bean and Brew is a five location coffee chain in Portland that serves around 2,000 customers per week. They had loyal regulars but very little visibility into who visited once and never came back. Their paper punch card loyalty program had only a 12 percent participation rate and could not track frequency or spend.
Owner Sarah Martinez estimated customer acquisition cost at 18 dollars per new customer through Instagram ads, with no clear view of second or third visits. She needed a system that:
- Incentivized repeat visits without heavy discounting.
- Captured visit data and feedback at scale.
- Reduced dependency on paid social.
VISU implementation strategy
Bean and Brew launched a VISU program with three core earning actions:
- QR check ins at the register—customers scanned a VISU code to earn 0.50 dollars per visit, with 2 dollar bonus on the fifth visit and 5 dollar bonus on the tenth.
- Seasonal menu feedback—after buying a new drink, customers were invited to answer a three minute survey for 1.50 dollars.
- Social sharing challenges—monthly Instagram story posts featuring drinks with a branded hashtag, paying 3 dollars on completion.
Setup took four weeks from decision to full rollout, including QR design, table tents, register stickers and staff training on a simple script: "Scan this code, we will literally pay you for your coffee habit."
Quantified results in 90 days
| Metric | Before VISU | After VISU | Change |
|---|---|---|---|
| Program enrollment | 12 percent (punch card) | 62 percent (VISU) | +416 percent |
| Visit frequency | 1.8 visits per month | 2.6 visits per month | +44 percent |
| 90 day retention | 34 percent | 81 percent | +138 percent |
| Acquisition cost | 18 dollars | 6.70 dollars | -63 percent |
Total reward payout over 90 days was 3,240 dollars. Including design, printing and VISU platform fees, the total investment came to roughly 4,387 dollars.
Incremental revenue driven by VISU users was estimated at 235,791 dollars, based on the difference between VISU and non VISU customer spend and frequency.
ROI: around 5,274 percent in 90 days.
Sarah sums it up simply: "The rewards are a line item. The data and repeat visits are the asset."
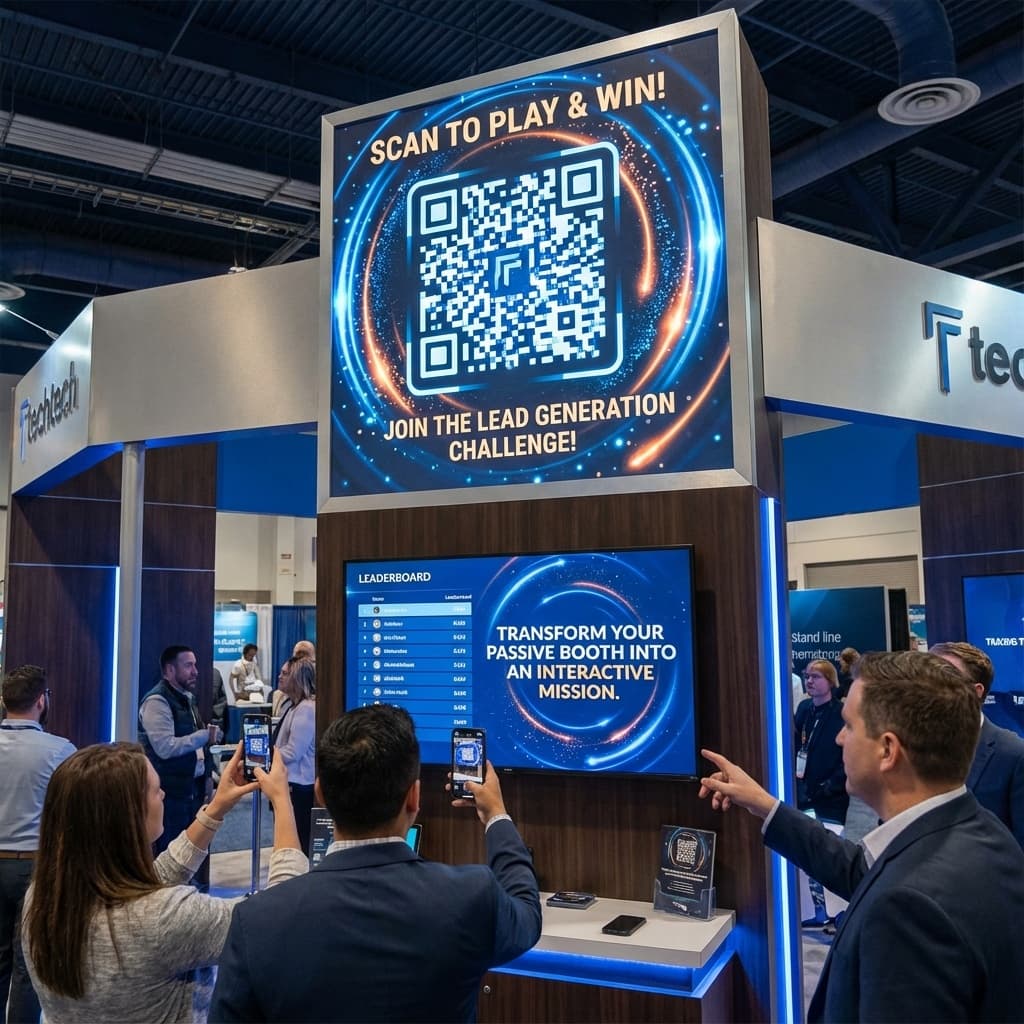
Case Study 2: Regional event company
Result: 28 percent booth engagement and 3.2x lead generation
Business profile and challenge
Experiential Edge is a Chicago based event marketing agency that designs trade show booths and brand activations. Their clients wanted proof that events drove real pipeline, not just foot traffic.
Badge scanning gave them email addresses but zero insight into how long attendees engaged or how interested they actually were. One enterprise client was considering cutting event budget by more than half because ROI was not clear.
VISU implementation strategy
Experiential Edge packaged VISU as part of a standard booth activation:
- Interactive product demos—after a three to five minute demo, attendees scanned a VISU QR to earn 4 dollars and completed a short survey.
- Gamified booth challenges—multi step missions that asked attendees to visit three zones, answer trivia and post on social, paying 8 to 12 dollars for full completion.
- Lead qualification surveys—a 10 question survey about budget, timeline and role, paying 6 dollars and replacing the classic business card fishbowl.
VISU setup, QR assets and analytics access were bundled into a 2,500 to 4,500 dollar add on for clients, framed as "measurable engagement layer".
Quantified results at a three day show
- 1,847 unique attendees engaged with VISU actions vs 420 badge scans at the previous show.
- 1,124 qualified leads completed the survey vs 89 usable leads before.
- 42 percent of leads flagged as high intent vs 11 percent previously.
- 18 percent of VISU leads booked a product demo within 30 days vs 4 percent of traditional leads.
- Cost per qualified lead dropped from 47 dollars to 7.78 dollars.
Reward payouts plus VISU fees for the show came to around 11,240 dollars. Within 90 days, the client closed 67 deals from VISU sourced leads with an average value of 3,400 dollars each, or 227,800 dollars in revenue.
ROI: around 1,926 percent on a single event.
For more on how businesses use location-based rewards, see our guide to apps that pay for store visits.
Case Study 3: Boutique fitness studio
Result: 19 percent new member acquisition and 54 percent referral rate
Business profile and challenge
CorePower Studio is a boutique yoga and pilates studio in Austin with around 340 active members. They relied heavily on Meta ads, spending significant budget to acquire new members at roughly 110 dollars each.
A classic "refer a friend for a free class" program generated only two or three referrals per month. Members liked the studio but did not feel motivated to actively promote it.
VISU implementation strategy
The studio launched a VISU powered growth engine:
- Class check in rewards—0.75 dollars per class whenever members scanned the VISU QR at the front desk.
- Referral bonuses—members earned a 15 dollar instant reward when a friend completed their first class plus 10 percent of the friend's VISU earnings over time.
- Review incentives—3 dollars for a detailed Google review.
Members received branded keychains with a QR code for quick check ins and referral sharing. The studio spent around 620 dollars on design and printing plus 149 dollars per month on VISU.
Quantified results in 120 days
| Metric | Previous 120 days | With VISU | Change |
|---|---|---|---|
| New members from referrals | 47 | 156 | +232 percent |
| Acquisition cost per member | 110 dollars | 31 dollars | -72 percent |
| 90 day retention | 71 percent | 89 percent | +18 points |
| New Google reviews | 11 | 94 | +754 percent |
Total VISU investment for four months was about 8,056 dollars. New VISU referred members had an average lifetime value around 1,260 dollars. With 156 new members, that equaled roughly 196,560 dollars in LTV.
ROI: around 2,339 percent from the first four months alone.
Case Study 4: Local restaurant group
Result: 17 percent engagement rate and 41 percent repeat visit increase
Business profile and challenge
Harvest Kitchen operates three farm to table restaurants in Denver. Weekend nights were strong, but weekday evenings were inconsistent and many visitors never returned.
Email marketing had open rates under 10 percent and click rates just above 1 percent. Traditional loyalty tactics were not moving the needle.
VISU implementation strategy
- Dining check ins—table tent QR codes paid 1.25 dollars per visit, with bonuses on third and sixth visits inside a 60 day window.
- Menu feedback—2 dollars for focused surveys on new dishes to guide pricing and portion decisions.
- Off peak incentives—a 3 dollar bonus for check ins Tuesday to Thursday between 5 and 7 pm.
Quantified results in 90 days
- 1,658 customers enrolled in VISU, around 37 percent of unique diners.
- Engagement rate of 17 percent per visit for at least one VISU action.
- Repeat visit rate increased by 41 percent among VISU users.
- Off peak weekday covers up by 28 percent.
- Survey insights led to portion adjustments that increased average ticket size by 23 percent.
Total VISU investment of roughly 5,507 dollars generated an estimated 154,194 dollars in incremental revenue tied to VISU customers.
ROI: around 2,701 percent in the first quarter.
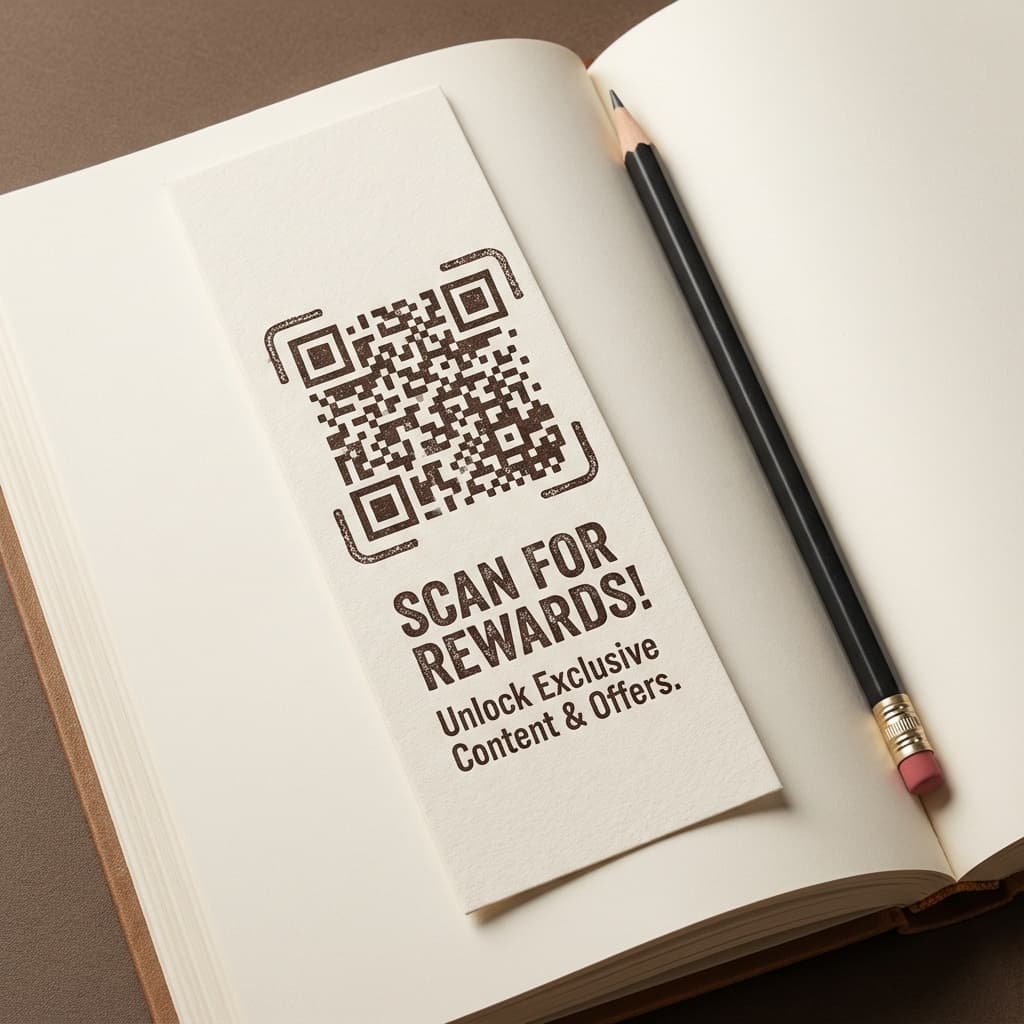
Case Study 5: Retail bookstore chain
Result: 21 percent engagement rate and 67 percent email list growth
Business profile and challenge
Chapter and Verse is a four location independent bookstore chain in Seattle. They cannot win on price or shipping speed against digital giants, so their strategy is community and curation.
The gap: very little customer data. Only 840 people were on their email list across more than 3,000 monthly customers. They lacked insight into reading preferences and purchase history.
VISU implementation strategy
- Purchase check ins—customers scanned a QR on the receipt or on a bookmark and earned 1 dollar per purchase while VISU captured transaction data.
- Book reviews—2.50 dollars for reviews above 100 words that could be featured on product pages and in store.
- Event attendance—4 dollars for scanning at author talks and book clubs.
- Monthly reading challenges—8 dollars for completing themed challenges tied to store displays.
Quantified results in 90 days
- 1,847 customers enrolled in VISU—around 58 percent of unique shoppers.
- Email list grew by 67 percent in one quarter.
- 284 detailed reviews were generated vs 19 in the previous 90 days.
- Author event attendance increased by 43 percent.
- VISU members visited 2.1 times per 90 days vs 1.3 times for non members.
Total VISU investment of around 6,467 dollars produced roughly 89,600 dollars in incremental revenue from higher visit frequency and larger baskets among VISU members.
ROI: around 1,286 percent in the first 90 days.
Ready to generate results like these?
Use the same model these businesses used: pay customers directly for attention and measure every action inside VISU.
Comparative analysis and cross industry patterns
Looking across all five case studies, the patterns are clear and repeatable. Industries, ticket sizes and customer demographics differ, but the mechanics of paying for attention are consistent.
- Engagement—VISU campaigns delivered 17 to 28 percent engagement vs the typical 2 to 5 percent for loyalty programs and 1 to 3 percent for email.
- Payback time—every business reached break even in roughly 21 to 45 days.
- Lifetime value—customers who used VISU had 98 to 187 percent higher LTV than non participants.
- Data quality—instead of impressions and likes, teams gained visit frequency, product preferences, price feedback and intent signals.
Success factors that repeat
- Staff training and enthusiasm—teams that actively presented VISU as a benefit saw three to four times more enrollment.
- Immediate, clear rewards—"scan and earn X today" worked far better than abstract points.
- Multiple earning actions—check ins plus surveys plus referrals outperformed single action setups.
- Physical integration—keychains, bookmarks and table tents beat generic QR posters on walls.
Want to understand the full mechanics? See our detailed guide on how VISU rewards work.
ROI framework: calculate VISU value for your business
Before you run a single campaign, you can model VISU ROI using a simple five step framework based on these case studies.
| Step | Action | Typical benchmark |
|---|---|---|
| 1. Estimate enrollment | Monthly customers multiplied by enrollment rate. | 30 to 60 percent. |
| 2. Estimate engagement | Enrolled users multiplied by actions per month. | 2 to 4 actions each. |
| 3. Calculate cost | (Actions multiplied by reward) plus VISU fee. | 1.50 dollars average reward. |
| 4. Estimate revenue lift | Enrolled users multiplied by LTV increase. | 30 to 90 percent LTV lift. |
| 5. Compute ROI | (Incremental revenue minus investment) divided by investment. | 800 to 2,500+ percent in 90 days. |
Industry specific benchmarks
- Retail—800 to 1,500 percent ROI driven mainly by increased visit frequency.
- Food and beverage—1,200 to 2,700 percent ROI driven by repeat visits and off peak fills.
- Fitness and wellness—1,800 to 2,400 percent ROI driven by referrals and lower acquisition cost.
- Events and experiential—1,500 to 2,000 percent ROI driven by higher volume and quality of leads.
Project your own ROI in minutes
Plug your numbers into a simple VISU ROI model and share it with your team before you launch a pilot.
How to implement a case study level VISU campaign
Phase 1—pre launch planning (weeks 1 to 2)
- Choose 1 or 2 main goals—for example increase repeat visits, fill off peak hours or capture product feedback.
- Define budget—estimate active customers, actions per month and reward per action, then add a 20 percent buffer.
- Design earning actions—match actions to goals: check ins for frequency, referrals for acquisition, surveys for insight.
Phase 2—launch execution (weeks 3 to 4)
- Train staff to present VISU as a gift, not a gimmick: "Scan this and we will pay you for your visit, it takes 30 seconds."
- Place QR codes on receipts, table tents, keychains, bags and any touchpoint that every customer sees.
- Soft launch with loyal customers, then adjust wording and design before full roll out.
For step-by-step mission setup, see how to earn through VISU missions.
Phase 3—optimization (weeks 5 to 12)
- Monitor enrollment, engagement, payout and incremental revenue weekly in the VISU dashboard.
- Identify drop off points and test changes in reward amounts, placements and scripts.
- Double down on the two to three highest performing actions, then add new ones as needed.
Your case study starts now
The businesses in this post did not run perfect campaigns. They started small, measured every action and iterated quickly. That is all you need to do to build your own numbers.
Join the next wave of VISU success stories
Test VISU for 60 days with a single campaign type, document the numbers and decide from data, not opinion.