

Healthcare organizations are drowning in data but starving for actionable insights. QR code tracking analytics bridge this gap by turning every scan into a measurable data point.
Unlike passive identification systems, modern QR platforms capture granular metrics. These include scan frequency, location data, user behavior, time-to-completion, and error rates. As a result, leaders can make faster, smarter operational decisions.
The urgency is clear. Hospitals face mounting pressure to reduce medication errors, which affect 1.5 million patients annually according to the FDA. At the same time, they must optimize staff utilization amid workforce shortages. Additionally, they need to demonstrate compliance with evolving regulations like the Drug Supply Chain Security Act (DSCSA).
QR code analytics provide the real-time visibility needed to address these challenges. Moreover, they support value-based care models that reward outcomes over volume.
Why Now Is the Right Time
Three converging trends make this the right moment for QR analytics in healthcare:
- Smartphone ubiquity: 95%+ of clinical staff carry smartphones
- Mature cloud platforms: Analytics tools now handle healthcare-scale data
- Proven ROI: Early adopters show measurable results
Organizations implementing comprehensive QR tracking report significant improvements:
- 40–60% reduction in medication administration errors
- 25–35% improvement in equipment utilization
- 15–20% decrease in patient wait times
These metrics directly impact both safety and financial performance.
Core Use Cases in Healthcare
QR code tracking analytics deliver measurable value across six critical healthcare workflows. Each use case generates distinct performance metrics that inform targeted improvements.
Patient Identification and Wristband Scanning
Patient misidentification contributes to an estimated 1,900 deaths annually. It also causes $398 million in malpractice costs. Manual verification processes are inconsistent and time-consuming.
QR-enabled wristbands paired with tracking analytics capture every patient verification event. Specifically, they record who scanned, when, where, and whether the scan matched EHR records.
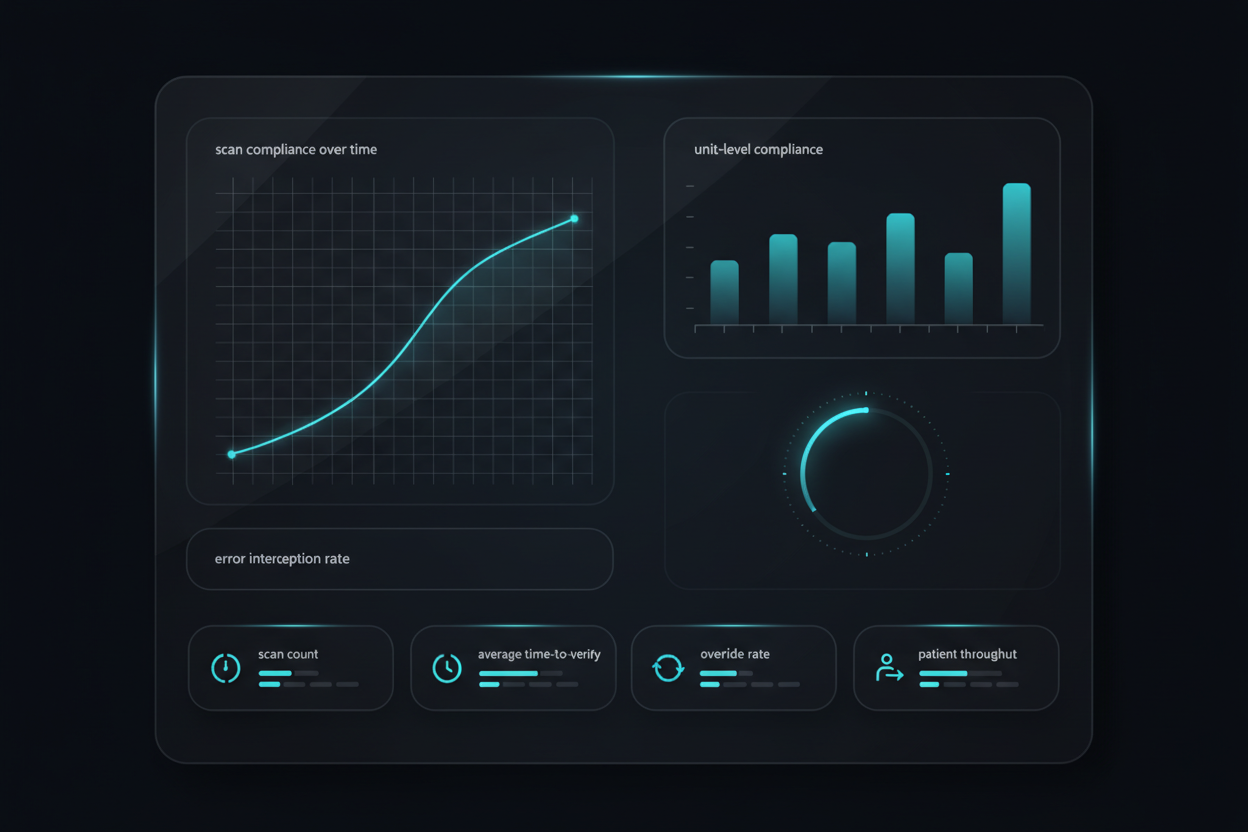
Dashboards then reveal compliance rates by unit, shift, and individual clinician. As a result, leaders can identify training needs and process gaps quickly.
Key Performance Indicators
- Scan compliance rate: Target above 98%
- Time-to-verify: Average under 8 seconds
- Mismatch alert frequency: Goal is declining trends
- Verification gaps: Target less than 0.5% of procedures without proper ID scan
For example, a 450-bed hospital system reduced patient ID errors by 73% within six months. They used scan analytics to identify high-risk scenarios such as shift changes, float staff, and emergency admissions. Then they implemented targeted interventions.
Medication Administration (BCMA)
Barcode Medication Administration (BCMA) systems prevent errors. However, workarounds and incomplete adoption undermine effectiveness. Without analytics, organizations lack visibility into actual usage patterns.
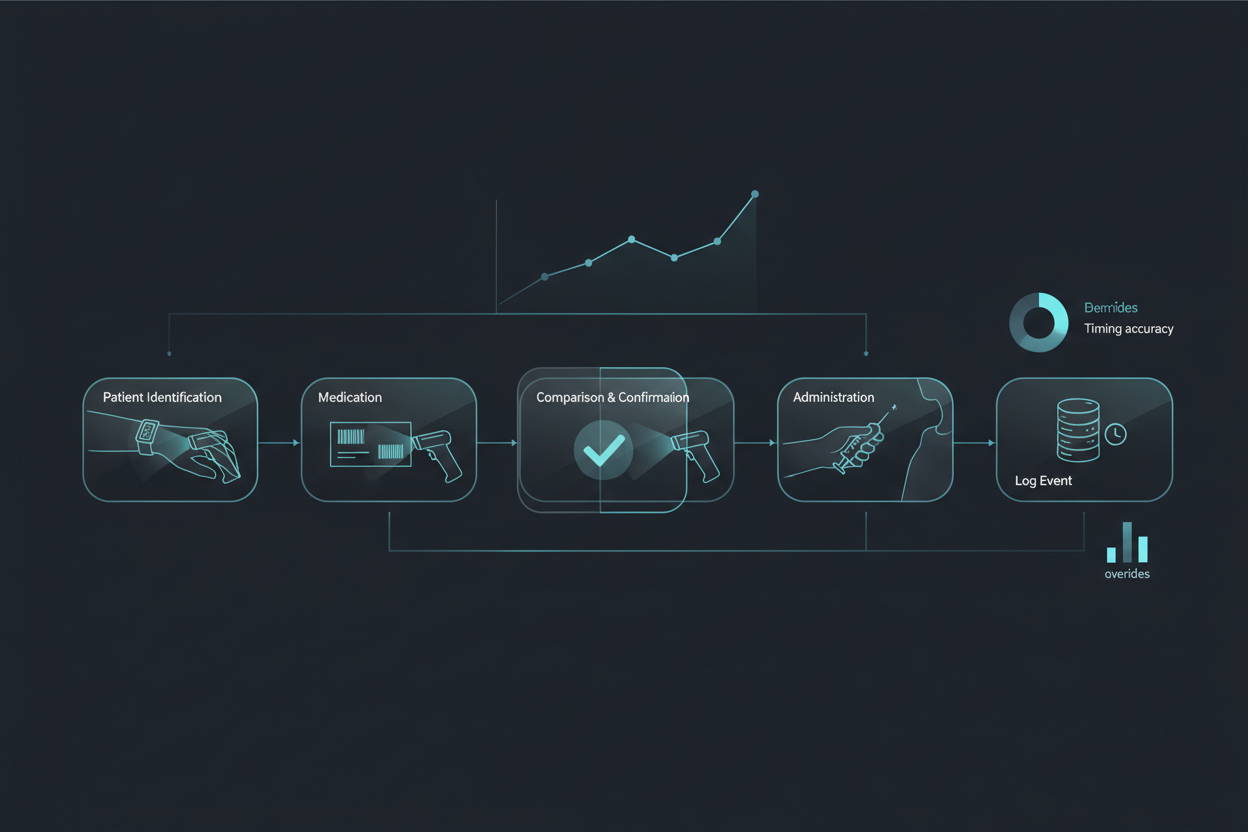
QR code tracking captures the complete medication administration workflow:
- Patient wristband scan
- Medication package scan
- Administration timestamp
- Override or workaround events
Analytics platforms then correlate this data with adverse drug events (ADEs) and near-misses. Consequently, organizations can quantify safety impact.
Key Metrics
- Five Rights compliance: Target above 95%
- Override rate: Benchmark below 3%
- Timing accuracy: Medications given within scheduled window above 90%
- Workaround frequency: Declining to below 1%
- Error interception rate: Per 1,000 administrations
Analytics often reveal that 80% of BCMA workarounds occur during specific scenarios. These include code situations, multiple simultaneous patients, and system downtime. Therefore, targeted training for these scenarios can eliminate the majority of risky behaviors.
Lab Specimen Chain of Custody
Specimen labeling errors occur in 0.1–1% of samples. This leads to misdiagnosis, treatment delays, and potential patient harm. Manual tracking provides no real-time visibility into specimen location or handling.
QR codes on specimen containers create a digital chain of custody from collection through analysis. Each scan at bedside, during transport, at lab receipt, and during processing generates a timestamped, geolocated record.
As a result, analytics can identify bottlenecks, track turnaround times, and flag anomalies like missing scans or unexpected delays.
Performance Indicators
- Labeling accuracy: Target above 99.5%
- Chain of custody completeness: Above 98%
- Turnaround time: Benchmarks vary by test type
- Lost specimen rate: Below 0.1%
- Temperature excursion events: Below 0.5%
For instance, a regional lab network reduced stat test turnaround time by 28%. They used QR analytics to identify transport delays and optimize courier routes based on actual scan data rather than assumptions.
Medical Equipment and Asset Tracking
Hospitals spend 15–20% of nursing time searching for equipment. Underutilized assets represent millions in wasted capital. Meanwhile, shortages delay care.
QR tags on equipment combined with scan-based check-out and check-in systems generate utilization data. They also track location history and maintenance records.
Analytics then reveal:
- Which assets are overused (candidates for additional purchases)
- Which are underused (redeployment opportunities)
- Which are missing (loss prevention)

Key Metrics
- Utilization rate: Benchmark 60–75% for high-value equipment
- Search time: Target under 5 minutes
- Availability rate: Above 95% for critical assets
- Maintenance compliance: Above 98%
- Loss/shrinkage rate: Below 2% annually
A 300-bed hospital avoided $1.2M in planned IV pump purchases by using QR tracking analytics. They discovered that 30% of existing pumps were sitting unused in storage areas. Simply redistributing these pumps solved the perceived shortage.
Patient Onboarding and Registration
Registration errors cause significant problems. Wrong insurance, outdated demographics, and missing consents lead to claim denials, compliance issues, and patient dissatisfaction. Manual data entry is slow and error-prone.
QR codes in pre-arrival communications enable patients to self-register via smartphone. The system auto-populates EHR fields and captures digital consent signatures.
Analytics then track completion rates, error frequencies, and time savings compared to traditional registration.
Performance Indicators
- Pre-registration completion rate: Target above 70%
- Data accuracy: Fields requiring staff correction below 5%
- Registration time: Under 8 minutes from arrival to care-ready
- Insurance verification rate: Above 95%
- Consent completeness: 100%
Outpatient clinics using QR-based pre-registration reduce front-desk staffing needs by 30–40%. At the same time, they improve patient satisfaction scores related to wait times.
Contactless Check-In and Wayfinding
Patients struggle to navigate complex healthcare facilities. This leads to missed appointments, delays, and frustration. Traditional signage is static and doesn't adapt to individual needs.
QR codes placed at entrances, elevators, and key decision points enable smartphone-based wayfinding. Each scan generates data on patient flow patterns, navigation pain points, and appointment punctuality.
Consequently, analytics inform facility layout improvements and signage optimization.
Key Metrics
- On-time arrival rate: Target above 85%
- Wayfinding engagement: 40–60% of patients using QR navigation
- Help desk inquiry reduction: Declining trend
- Scan pattern analysis: Identifying common confusion points
- No-show reduction: Target 5–10% improvement
A large medical center reduced missed appointments by 12% by analyzing QR wayfinding data. They discovered that parking garage signage was inadequate. Patients were arriving on time but couldn't find the entrance.
Safety, Compliance and Security
QR code tracking analytics directly support regulatory compliance and patient safety initiatives. However, they also introduce new security considerations that require careful management.
HIPAA and Data Privacy
QR tracking systems must meet strict privacy requirements:
- Encrypt patient identifiers
- Implement role-based access controls
- Maintain comprehensive audit trails
- Anonymize data for aggregate reporting
- Preserve ability to investigate specific incidents
Additionally, ensure Business Associate Agreements (BAAs) cover all vendors in the QR tracking ecosystem.
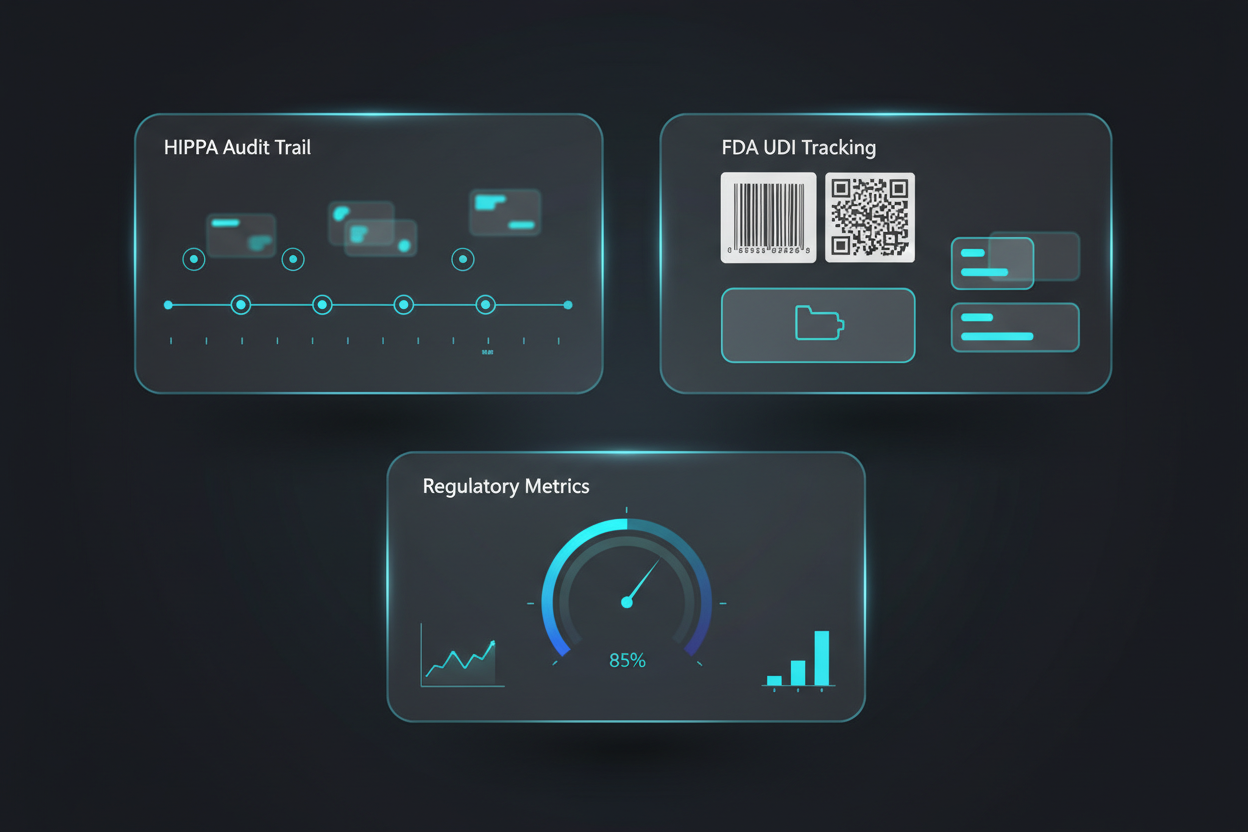
FDA UDI Requirements
The FDA's Unique Device Identification (UDI) system mandates barcodes on medical devices. QR tracking analytics help hospitals comply with UDI requirements.
Moreover, they support adverse event reporting and recall management. Analytics can automatically flag affected devices and track removal from circulation.
Joint Commission Standards
The Joint Commission's National Patient Safety Goals (NPSGs) require accurate patient identification and medication safety processes.
QR tracking analytics provide objective evidence of compliance during surveys. Dashboards show scan rates, error interceptions, and continuous improvement trends.
Security Best Practices
To protect QR tracking systems, follow these guidelines:
- Dynamic QR codes: Use time-limited, encrypted codes for sensitive applications rather than static codes
- Authentication layers: Require user login before accessing patient data via QR scan
- Geofencing: Restrict QR code functionality to authorized locations
- Anomaly detection: Flag unusual patterns such as excessive scans or off-hours access
- Incident response: Include rapid code rotation and access revocation procedures
Implementation Blueprint: Pilot to Scale
Successful QR code tracking analytics implementations follow a structured approach. This proves value quickly while building toward enterprise-wide adoption.
Phase 1: Pilot Selection and Baseline (Weeks 1–4)
First, choose a high-impact use case with clear pain points, measurable outcomes, and executive visibility. BCMA is often ideal.
Key activities include:
- Define success metrics and establish baseline KPIs
- Select a pilot unit with engaged leadership and tech-savvy staff (20–40 users)
- Assemble cross-functional team (clinical champions, IT, quality/safety, analytics)
- Evaluate vendors on EHR integration, analytics depth, and healthcare-specific features
Phase 2: Pilot Deployment (Weeks 5–12)
Next, focus on technical integration and training:
- Technical integration: Connect QR platform to EHR and other systems via HL7 FHIR APIs
- Workflow design: Map current-state processes and design QR-enhanced workflows
- Staff training: Provide hands-on sessions emphasizing the "why" behind tracking
- Soft launch: Begin with observation mode to identify issues before go-live
- Go-live support: Provide at-the-elbow assistance during the first week

Phase 3: Optimization and Measurement (Weeks 13–20)
Then, focus on continuous improvement:
- Weekly analytics reviews: Examine dashboards with pilot team to identify trends
- Iterative refinement: Adjust workflows and system configuration based on real usage
- Compliance monitoring: Track adoption rates and address resistance
- ROI documentation: Calculate cost savings and efficiency gains
- Success story development: Document examples for executive presentations
Phase 4: Enterprise Scaling (Months 6–12)
Finally, expand across the organization:
- Rollout planning: Prioritize additional units based on pilot learnings
- Change management: Use pilot champions as trainers in new departments
- Infrastructure scaling: Ensure network and device capacity for organization-wide usage
- Analytics maturity: Progress from descriptive reporting to predictive analytics
- Continuous improvement: Establish ongoing governance for optimization
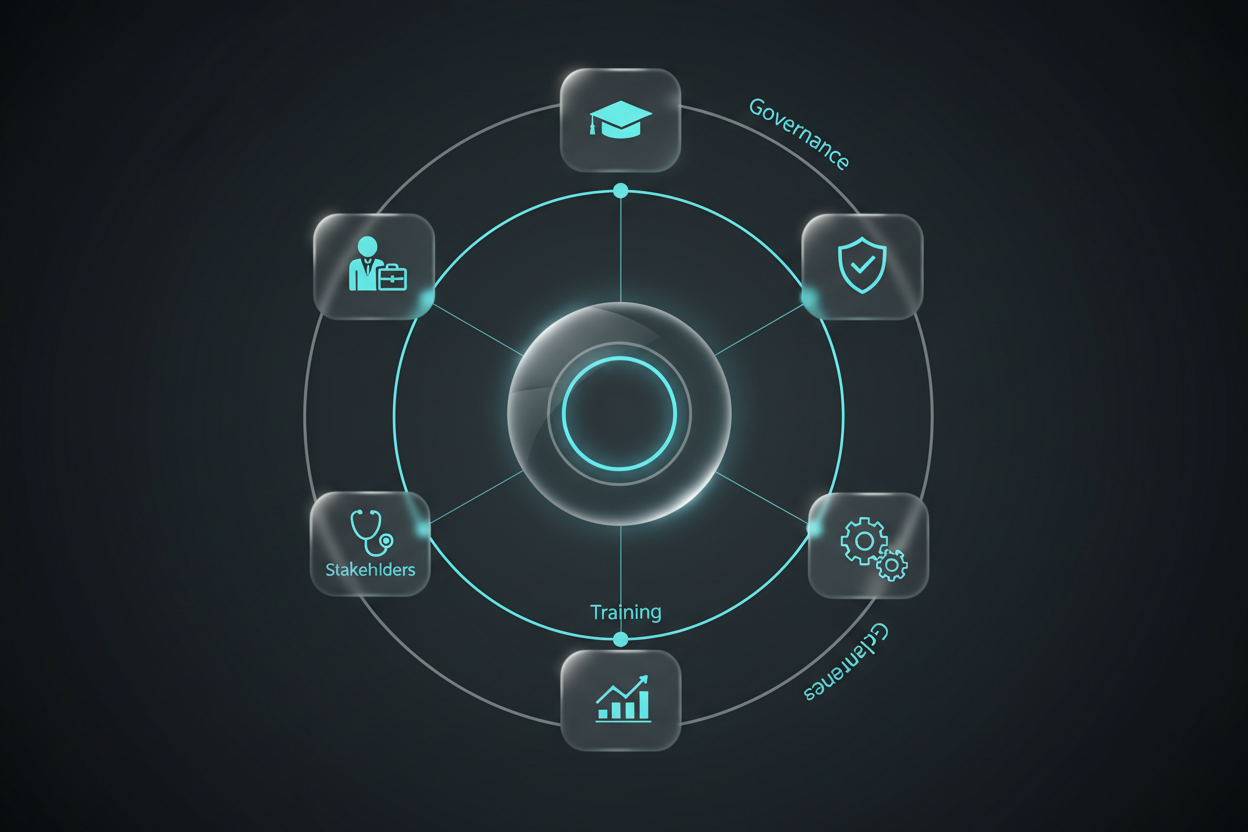
Critical Success Factors
- Executive sponsorship with visible support
- Clinical champion engagement at every level
- Realistic timelines that allow for learning
- Celebration of early wins to build momentum
ROI and Measurement Framework
QR code tracking analytics investments typically achieve positive ROI within 12–18 months. This comes through a combination of hard cost savings, soft cost avoidance, and revenue protection.
Direct Cost Savings
- Labor efficiency: Reduced time searching for equipment, faster patient registration, streamlined medication administration
- Asset optimization: Avoided equipment purchases through better utilization and reduced loss
- Supply chain savings: Decreased expired medication waste and optimized inventory levels
- Administrative savings: Fewer claim denials from registration errors
Cost Avoidance
- Error prevention: Medication errors, patient misidentification, and wrong-site procedures avoided
- Compliance: Regulatory fines avoided and survey deficiencies prevented
- Rework elimination: Fewer specimen recollections, repeated procedures, and corrected documentation
Revenue Protection and Enhancement
- Throughput improvement: Reduced wait times enabling higher volumes
- Length of stay reduction: Faster workflows and fewer complications
- Patient satisfaction: Better scores affecting reimbursement and market share
- Charge capture: Better documentation of supplies and services used
Sample ROI Calculation
For a 300-bed hospital with BCMA focus:
Investment: $250K (software licenses, implementation, training, mobile devices)
Annual Benefits:
- Medication errors prevented: 45 incidents × $15K = $675K
- Nursing time saved: 8,000 hours × $45/hour = $360K
- Pharmacy waste reduction: $85K
- Compliance risk mitigation: $120K (risk-adjusted)
Total annual benefit: $1,240K
Net ROI: 396% in first year
Payback period: 2.4 months
Turn Every Scan Into Clinical and Operational Insight
VISU helps hospitals track scans, workflows, and outcomes in real time.
Common Pitfalls to Avoid
Organizations implementing QR code tracking analytics encounter predictable challenges. Anticipating these pitfalls enables proactive mitigation.
Technology-First Approach
Deploying QR systems without redesigning workflows leads to technology layered onto broken processes. Instead, conduct workflow analysis first. Design optimal processes, then implement technology to support them.
Inadequate Integration
Standalone QR systems that don't connect to EHRs create data silos and duplicate work. Therefore, require bidirectional HL7 FHIR integration as a vendor selection criterion, not a nice-to-have.
Analytics Overload
Dashboards with 50+ metrics overwhelm users and obscure insights. Start with 5–7 critical KPIs aligned to strategic goals. Then add complexity gradually as analytics maturity increases.
Insufficient Change Management
Assuming staff will automatically adopt new scanning requirements undermines adoption. Address the "why" and "what's in it for me" directly. Invest in training, use clinical champions, and celebrate early wins publicly.
Mobile Device Limitations
Inadequate smartphone availability forces staff to share devices. This creates bottlenecks and hygiene concerns. Budget for sufficient devices (1:1 or 1:2 ratio) with antimicrobial cases and charging infrastructure.
Network Dependency
QR systems requiring constant connectivity fail during network outages. This creates safety risks. Implement offline mode with local caching and automatic sync when connectivity restores.
Alert Fatigue
Excessive notifications train users to ignore important alerts. Carefully tune alert thresholds and use tiered urgency levels. Regularly review alert response rates.
Privacy Missteps
Tracking employee movements without transparency creates distrust and potential legal issues. Clearly communicate what's tracked and why. Focus analytics on process improvement, not individual surveillance.
Vendor Lock-In
Proprietary QR formats make it difficult to switch vendors or integrate new systems. Require open standards (GS1, ISO/IEC 18004), data portability guarantees, and API documentation in contracts.
Neglecting Maintenance
QR codes fade, get damaged, or become outdated. Implement automated quality checks with unreadable code alerts. Schedule replacement cycles and use durable printing methods for high-use applications.
Future Outlook: Next-Generation QR Analytics
QR code tracking analytics are evolving rapidly. Emerging capabilities will further transform healthcare operations over the next 3–5 years.
AI-Powered Predictive Analytics
Machine learning algorithms will analyze historical QR tracking data to:
- Predict equipment failures before they occur
- Forecast medication demand with greater accuracy
- Identify patients at risk for adverse events based on workflow deviations
Early implementations show 30–40% improvement in predictive accuracy compared to traditional methods.
Computer Vision Integration
Combining QR codes with computer vision enables automatic verification:
- Right medication was scanned (detecting packaging mismatches)
- Proper equipment setup (comparing camera image to reference standard)
- Hand hygiene compliance (detecting scan without preceding handwashing)
This multi-modal approach catches errors that single-method systems miss.
Blockchain for Chain of Custody
Distributed ledger technology will create immutable audit trails for high-stakes applications:
- Controlled substance tracking
- Clinical trial specimen management
- Organ transplant logistics
Blockchain-based QR tracking provides cryptographic proof of custody that satisfies regulatory requirements.
Ambient Intelligence
QR codes will increasingly work alongside RFID, BLE beacons, and IoT sensors. This creates comprehensive location awareness without requiring manual scans. Analytics will fuse data from multiple sources for complete visibility.
Interoperability Standards
The SMART on FHIR framework and HL7 FHIR R5 will enable QR tracking data to flow seamlessly across EHRs and analytics platforms. This will support population health initiatives and cross-organizational quality improvement.
Patient-Generated Data
Consumer health devices and patient-facing apps will use QR codes to link personal health data to clinical records. Analytics will integrate patient-reported outcomes, remote monitoring data, and social determinants captured via QR-enabled surveys.
Augmented Reality Overlays
AR-enabled smartphones will display real-time analytics when scanning QR codes. Users will see equipment usage history, patient risk scores, or procedure instructions overlaid on the physical environment.
Regulatory Evolution
Expect expanded mandates for track-and-trace capabilities in:
- Pharmaceuticals (DSCSA enforcement)
- Medical devices (FDA UDI expansion)
- Patient safety (potential CMS quality measures)
Organizations with mature QR analytics will adapt more easily to new requirements.
Action Plan and Next Steps
Ready to implement QR code tracking analytics? Follow this practical roadmap to move from concept to value realization.
Immediate Actions (This Week)
- Assess current state: Inventory existing barcode/QR usage and identify pain points
- Build business case: Use the ROI framework to estimate financial impact
- Identify executive sponsor: Find a CNO, CMO, or COO who will provide visible support
- Form exploration team: Assemble representatives from clinical operations, IT, quality, and analytics
Near-Term Actions (Next 30 Days)
- Conduct vendor research: Request demos from 3–5 QR tracking platforms
- Arrange site visits: Learn from peer organizations that have implemented similar systems
- Complete pilot planning: Select initial use case and define success criteria
- Secure budget: Plan for pilot phase (typically $50–150K depending on scope)
90-Day Milestones
- Complete vendor selection and contract negotiation
- Validate technical readiness (network, devices, EHR integration)
- Begin pilot launch with comprehensive training
- Review early results and identify adjustments
Six-Month Goals
- Complete pilot with 90%+ scan compliance
- Validate ROI with objective data
- Obtain scaling approval from leadership
- Develop phased expansion plan
The path from QR code tracking concept to measurable improvement is well-established. Organizations that move decisively achieve significant returns in safety, efficiency, and financial performance.
The question isn't whether QR analytics will transform your operations. It's whether you'll lead or follow in this transformation.
Run a QR Analytics Pilot in Your Hospital
Start with one workflow, measure impact, and scale a proven model of safety and efficiency with VISU.