

Loyalty programs are everywhere in 2026, but not every program actually pays off. Boards and finance teams are asking harder questions. Is this program really profitable or just an expensive habit We gave customers points and perks, but did we really increase revenue, retention and customer lifetime value If you cannot answer these questions with clear numbers, your loyalty budget is always at risk.
At the same time, loyalty has become more complex. Programs now combine points, tiers, micro rewards, missions, subscriptions and partner offers. They run across ecommerce, mobile apps and physical locations. That means loyalty ROI is not a single number. It is a set of signals that show how your program changes behavior and how much value that behavior creates.
This guide explains how to calculate loyalty program ROI in 2026, which metrics matter, and what benchmark ranges you can use as a reference. You will see how to connect revenue, engagement and cost data in a way that finance teams trust. Throughout the article, we also show how a unified engagement layer like VISU Solutions makes it easier to track ROI across offline and online touchpoints.
Why Loyalty Program ROI Is So Hard To Prove
Proving loyalty ROI sounds simple in theory. You compare members and non members, look at spend and retention, then calculate incremental revenue. In practice, it is more complicated. Your best customers are also the most likely to join the program, and external factors like pricing, seasonality and promotions affect results. Without a structured approach, it is easy to either overestimate or underestimate the true impact of your program.
Another difficulty is incomplete data. Many brands track loyalty activity inside one system and customer behavior in other tools. Offline engagement, such as QR scans in store or event missions, is often missing from the ROI model entirely. As a result, the program appears weaker than it really is, because some of its strongest effects are invisible in the spreadsheets.
Costs are also more complex than a reward budget. To understand ROI, you need to include technology fees, discounts, operational effort, marketing costs and any cannibalization of full price purchases. When these elements are not included, ROI numbers look artificially high, which leads to bad decisions later.
Finally, many teams use vanity metrics as proxies for ROI. High enrollment, app logins or email open rates can be helpful signals, but they are not proof of financial impact. Real ROI models always link back to revenue, margin and retention, even when they use engagement metrics as intermediate indicators.
The good news is that once you define the right metrics and build a consistent framework, loyalty ROI becomes far easier to track and improve over time.
Common mistakes that hide true loyalty ROI
- Comparing members and non members without adjusting for existing customer value.
- Ignoring offline engagement signals like QR scans, in store visits or missions.
- Counting only reward costs and forgetting technology and operating expenses.
- Relying on enrollment, app usage or impressions instead of financial metrics.
- Measuring ROI once per year instead of as a continuous, testable process.
Fixing these mistakes starts with a better metric stack and clear formulas that finance and marketing can align on.
Key Metrics And Formulas For Loyalty Program ROI In 2026
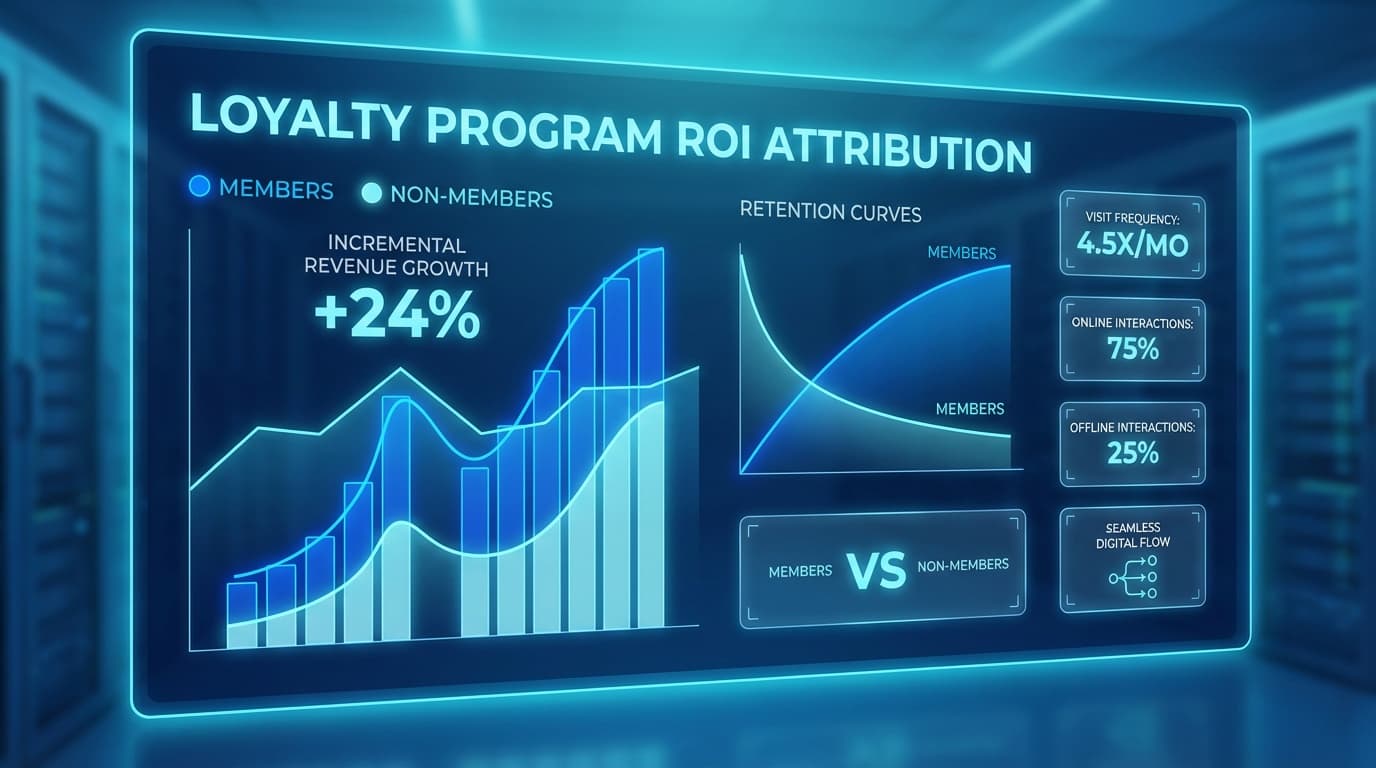
To calculate ROI with confidence, you need a small set of core metrics that quantify both upside and cost. The goal is not to track everything. It is to track the measures that directly show whether the program is creating incremental value. In 2026, most advanced loyalty teams focus on three pillars: incremental revenue, retention and engagement quality.
Incremental revenue is the extra money you earn because of the program, compared to what similar customers would have generated without it. Retention measures how long customers stay and how often they come back. Engagement quality captures behaviors that lead to future revenue, such as mission completion, cross category exploration or high value QR interactions.
On the cost side, you have rewards, discounts, technology, operations and any marketing spend dedicated to the program. Once you quantify both sides, you can apply simple ROI and payback formulas. For omnichannel brands, it is important to include offline signals in these metrics. QR based journeys, smart links and mission data from tools like VISU Products help fill that gap.
A simple high level loyalty ROI formula looks like this: ROI equals incremental profit from members minus total costs, divided by total costs. While the formula is straightforward, calculating incremental profit correctly is where most of the work happens.
Below are some of the most useful metrics and formulas you can standardize with your analytics or finance teams.
Key loyalty ROI metrics and formulas
- Incremental Revenue per Member
Revenue from members minus baseline revenue from comparable non members, divided by number of members. - Incremental Profit
Incremental revenue multiplied by gross margin, minus total program costs. - Loyalty ROI
(Incremental profit − program costs) ÷ program costs, expressed as a percentage. - Payback Period
Program costs divided by average monthly incremental profit, which shows how many months it takes to break even. - Member Lifetime Value Lift
LTV of members divided by LTV of non members, which shows how much more valuable loyal customers are. - Engaged Member Rate
Percentage of members who perform at least one meaningful action per period, such as a mission step, QR scan or reward redemption.
Once these metrics are defined, you can use them to build simple dashboards that show whether the program is on track, which segments are most profitable and where optimization will have the biggest impact.
2026 Loyalty ROI Benchmarks: What Good Looks Like
Every brand and industry is different, so benchmarks should be used as reference points, not rigid targets. Still, having ranges is helpful when you want to validate if your program is underperforming, average or above average. In 2026, most loyalty reports point in the same direction: well designed programs create clear incremental value, but results vary significantly depending on execution.
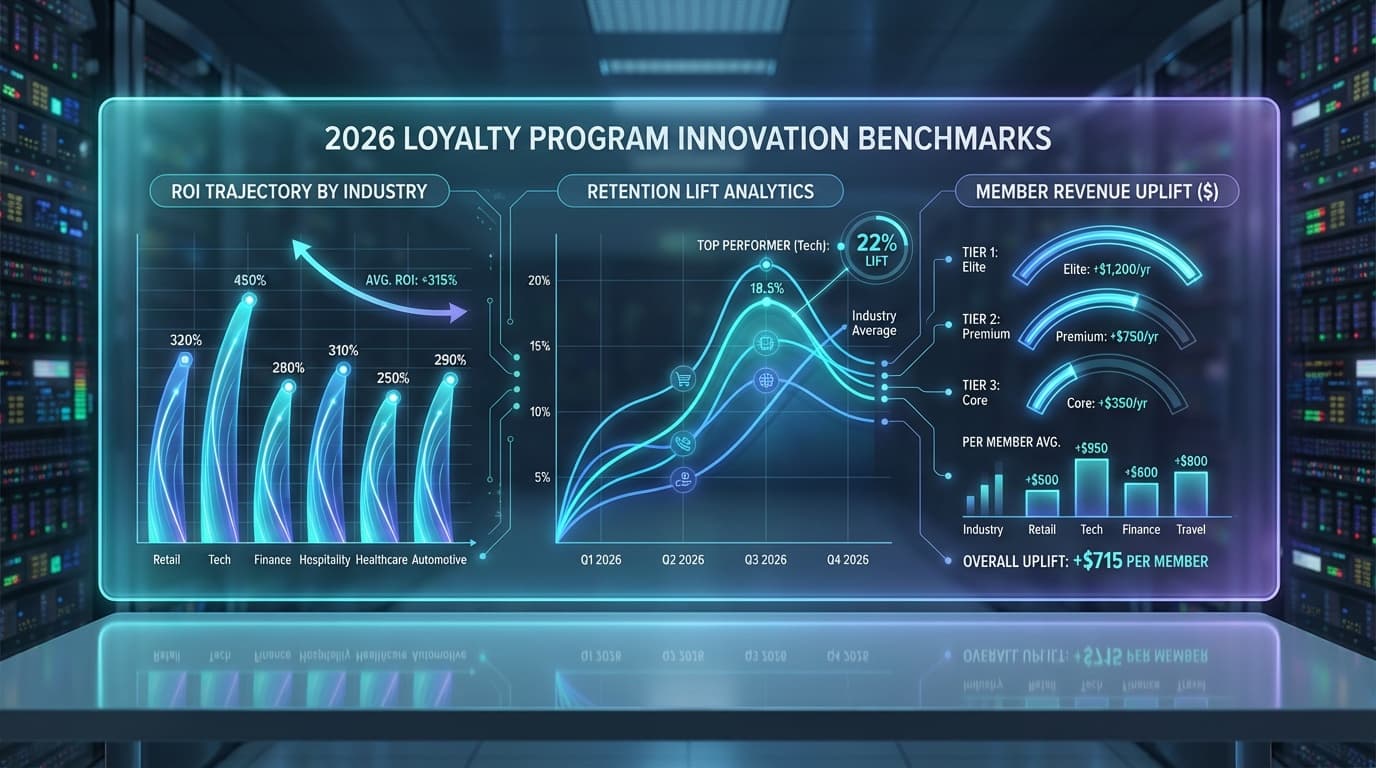
Across multiple benchmark studies, a few patterns emerge. First, most companies that measure correctly report positive ROI, although the magnitude varies. Second, high performing programs tend to see much stronger retention and revenue lift than average ones. Third, programs that connect online and offline behavior usually outperform those limited to a single channel.
For example, some studies report that members can generate between 12 and 18 percent more incremental revenue per year than non members when the program is well structured and actively promoted. Other benchmarks show that brands often see positive ROI within the first year when they combine loyalty with better personalization and journey design.
The goal is not to chase someone else’s number. It is to understand where you are now and what is realistically achievable with your audience, brand and margins. Benchmarks are most useful as a conversation starter with stakeholders, not as a rigid scoreboard.
Below are example ranges based on typical benchmark reports and industry experience. You should always calibrate them against your own data, expectations and constraints.
Example 2026 loyalty ROI benchmark ranges
- Member revenue uplift: 10 to 25 percent higher annual revenue for members versus comparable non members.
- Retention lift: 5 to 20 percent lower churn for members, depending on industry.
- Program ROI: 3x to 10x incremental profit relative to program costs for mature programs.
- Payback period: 6 to 18 months for most well executed loyalty initiatives.
- Engaged member rate: 40 to 70 percent of members performing at least one meaningful action per quarter.
If your program is significantly below these ranges, it might be under resourced, poorly targeted or missing strong engagement mechanics. If you are above them, you have a strong story for internal stakeholders and potential partners.
How To Improve Loyalty ROI With Better Journeys And Micro Rewards
Once you can measure ROI, the next step is improving it. The fastest wins usually come from increasing engagement quality, not just adding more discounts. If your program simply gives a flat percentage off, customers will use it when convenient but will not change their behavior significantly. To grow ROI, you need customers to visit more often, try new categories, respond to missions and stay longer with your brand.
This is where journey design and micro rewards change the game. Instead of only rewarding purchases, you reward the behaviors that lead to more valuable relationships. That includes scanning QR codes in store, exploring educational content, joining challenges, referring friends or returning during key periods.
Micro rewards are small incentives delivered instantly at key moments. They include surprise bonuses, mission progress, early access, or small credit amounts. On their own, each reward is small and affordable. Together, they create a strong sense of momentum that nudges customers deeper into the program without destroying margins.
When these elements run through a unified engagement layer, you can test which combinations drive the highest ROI. For example, you can compare a mission that offers points only against one that adds a surprise micro reward at the end. Over time, the program becomes a portfolio of proven journeys rather than a collection of static perks.
Platforms that connect QR codes, smart links, missions and micro rewards make this much easier to manage at scale. You design once, launch across physical and digital touchpoints, and then optimize based on data instead of guesswork.
Practical ways to boost loyalty program ROI
- Add mission based journeys that reward exploration, not just purchase events.
- Use QR touchpoints in stores and events to turn offline visits into measurable engagement.
- Introduce micro rewards that create frequent small wins without large discounts.
- Segment members by behavior and focus stronger rewards on high potential segments.
- Test different offers, journeys and timings, then allocate budget to the highest ROI paths.
Over time, your program becomes less of a static discount mechanism and more of a dynamic engine that shapes customer behavior in measurable ways.
Conclusion: Treat Loyalty As An Investment, Not A Discount Line
Loyalty programs in 2026 are under more scrutiny, but they also have more potential than ever. When you measure the right metrics, connect online and offline data, and focus on behavior change instead of blanket discounts, loyalty becomes a clear investment with visible returns. Programs that cannot show ROI will slowly be reduced to smaller roles. Programs that can prove their value will gain more budget, more executive support and more strategic relevance.
The path forward is clear. Start by fixing measurement, then benchmark your performance, and finally run systematic experiments to improve ROI. Use journeys, missions and micro rewards to create deeper engagement instead of bigger discounts. Make sure your technology stack, including tools like VISU, gives you a full view of customer behavior across channels.
When loyalty is treated as an investment and managed with the same discipline as any other growth initiative, it becomes one of the most powerful levers you have for long term revenue and retention.
Turn Attention Into Growth
Capture every interaction with VISU.