

QR code tracking is no longer a technical detail. It has become the centerpiece of any serious campaign. In a marketing world increasingly driven by data, measuring the performance of each scan is what separates curiosity from conversion and vanity metrics from real results.
Brands, events, influencers, and small businesses have already understood that QR codes are not just shortcuts. When you track properly, they become an analytics layer that shows who engaged, when, where, and what happened next. For broader context on QR code marketing strategies, see our complete guide. Consumers can even get paid for their attention when engaging with tracked QR experiences.
This guide covers what real tracking means, the metrics that matter, practical applications across industries, and how to use data to continuously optimize campaigns.
Get Paid to Scan QR Codes
Turn your attention into real rewards. Scan, engage, earn.
Quick video. Earn your first reward.
What Real QR Code Tracking Means
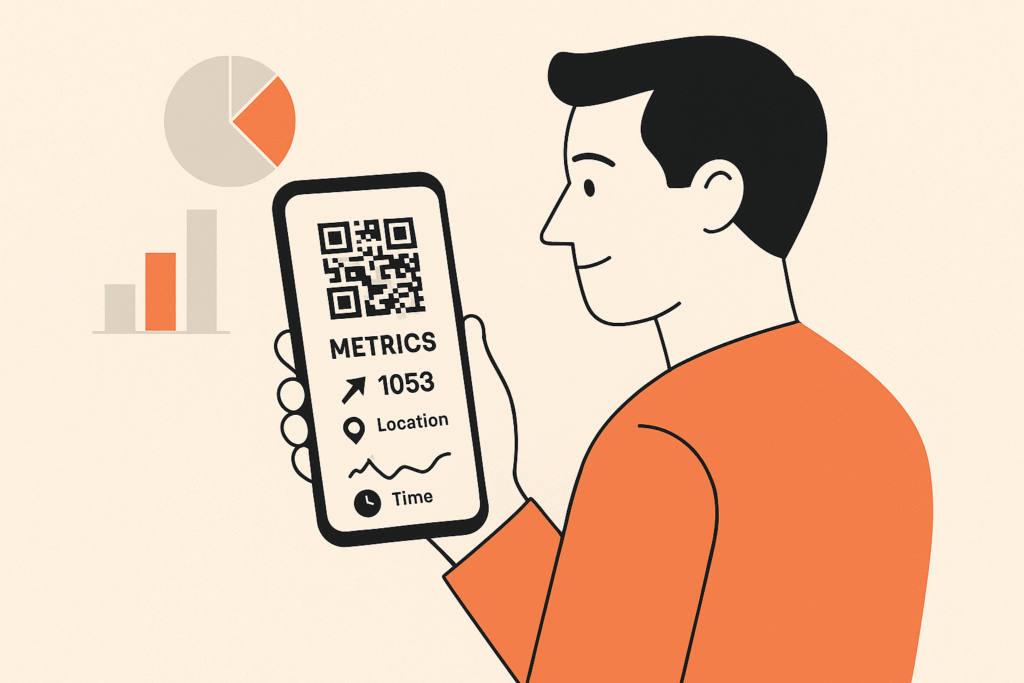
QR code tracking means monitoring everything that happens from each code created. Who scanned, in which city, at what time, on which device, and whether that attention turned into a signup, visit, or sale.
In practice, it is not just counting how many scans occurred. Proper tracking lets you see access locations to understand where the campaign really performed, time and frequency to discover the best engagement moments, device type such as Android, iOS, or desktop to adjust the experience, and conversion rate to know how many scans became clicks, signups, or purchases.
With this, QR code tracking stops being "nice to have" and becomes the foundation for validating strategy, adjusting creatives, choosing channels, and proving media ROI. Understanding which engagement metrics that matter helps you focus on what drives results.
Metrics That Matter in QR Code Tracking
Just like digital campaigns, QR code tracking offers a complete panel of indicators that inform optimization decisions.
Engagement Volume
This is the total number of scans. It shows how much your piece grabbed attention and whether the offer was strong enough to stimulate the scan. Volume alone does not indicate success, but it establishes the baseline for all other calculations.
Geographic Location
Reveals which neighborhoods, cities, or regions your campaign performs best in. This helps direct media and local actions where interest is real. Location data also identifies unexpected markets worth expanding into.
Peak Hours
Shows which days and time slots the audience is most active. Perfect for aligning campaign launches, social reinforcements, and flash promotions. If scans spike at lunch, that insight shapes future scheduling.
Device and Operating System
Understanding whether scans come more from Android, iOS, or desktop helps adjust pages, video formats, payment methods, and even messaging. A campaign heavy on iOS users might prioritize Apple Pay integration.
Conversion Rate
This is the proportion of scans that generated a concrete action. It could be signup, download, contact submission, or purchase. Without this metric, you are only measuring curiosity, not results.
Retention Time
In some flows, you can see how long the person stayed on the page or journey after the scan. Very short time indicates a weak offer or confusing experience. This metric helps diagnose post-scan drop-off.
When these metrics work together, the QR code stops being a static square and becomes a market intelligence tool.
QR Code Tracking in Practice
The same concept adapts to completely different sectors, from retail to large events. The key is using dynamic vs static QR codes that enable tracking from the start.
Physical and Digital Marketing Campaigns
Billboards, posters, flyers, and videos with tracked QR codes allow measuring, in real time, which pieces bring more visits, signups, and sales. You can see offline media ROI as if it were a digital ad. No more guessing which billboard worked.
Events and Trade Shows
Organizers use QR codes for check-in, access to exclusive content, raffles, and quick surveys. With active tracking, you can know which talks engaged most, which booths attracted more people, and how to follow up on the relationship afterward.
Product Packaging
Food, beverage, and consumer goods industries place QR codes on packaging to unlock recipes, manuals, loyalty programs, or reviews. Tracking shows which regions the product moves most in and which campaigns drive repeat purchases.
Digital Influencers
Each creator receives an exclusive QR. This way, the brand clearly sees how many scans, signups, and sales each partner generated. No more discussing performance based on "estimated reach." The data is concrete.
Ready to Innovate Your Customer Experience?
See how businesses use VISU to turn QR scans into measurable engagement.
Advanced Analytics: Using Data to Adjust Campaigns
The real value of tracking lies in how you react to data, not just looking at a dashboard.
A/B Testing with QR Codes
You can create two QR codes that lead to the same destination but on different pieces. For example, two posters with distinct creatives. Tracking shows which version generates more scans and conversions and eliminates guesswork in design decisions.
Channel Comparison
One QR for poster, another for packaging, another for Instagram post. With separate codes, it becomes clear which channel brings more qualified traffic and which is just generating impressions without action.
Fast and Continuous Adjustment
If a region does not respond well, you can change the offer, channel, or even redirect budget without waiting to close the month. With dynamic QR, even the destination can be updated in seconds without reprinting.
This level of precision is what differentiates campaigns based on feeling from truly data-driven strategies. Understanding QR code security ensures your tracking data remains accurate and protected from fraud.
Direct Benefits of Investing in Tracking
More than metrics for reports, QR code tracking generates objective gains for the business.
Total Transparency
You see the performance of each campaign, piece, and partner in numbers. It becomes easier to justify budget and show results to leadership or clients with concrete data rather than estimates.
More Efficient Media
Campaigns are adjusted based on real data. Weak channels are cut, weak creatives are replaced, and budget goes to what actually works. Media waste decreases while effectiveness increases.
Proven ROI
When scans, visits, and sales are connected, you move from "we believe it worked" to "this piece generated X sales at cost Y." This clarity changes budget conversations.
Integration with Existing Stack
Tracking data can feed CRM, automation tools, BI, and performance dashboards. The QR becomes another rich source of first-party data in your operation, connecting offline touchpoints to online systems. Understanding QR code data capacity helps optimize what information you encode.
The Future of QR Code Tracking
What is already powerful today tends to become even more sophisticated as new technologies enter the game.
Predictive Models and Artificial Intelligence
With historical data on scans, campaigns, and conversions, it becomes possible to predict results before the campaign even launches. This helps plan media and avoid bad bets based on pattern recognition.
Security and Auditing with Blockchain
Immutable scan records can provide much more confidence in incentive reports, cashback, or reward campaigns. Fraud becomes harder when every interaction is verifiably recorded.
Real Omnichannel Vision
Dashboards that cross QR code tracking data with social media, organic traffic, and paid media data provide a complete view of the journey. The scan becomes another clear touchpoint within the full funnel.
Dynamic Contextual Engagement
QR codes that change destination based on time, location, or customer type allow much more relevant offers and reduce attention waste. The same code can serve different experiences to different audiences.
When you put all this together, QR code tracking stops being a technical detail and becomes a strategic data and intelligence asset.
Final Reflection
QR code tracking is the piece that transforms curiosity into data, data into decision, and decision into results. Without it, the QR is just a shortcut. With it, every scan becomes strategic information for marketing, sales, and product.
At VISU, every QR code is born with tracking, rewards, and attribution in mind. The idea is simple: if someone gave attention and scanned, that attention needs to return as learning, revenue, or relationship.
Transform Every Scan Into Revenue
Join businesses already using VISU for gamified QR experiences.